NullFox
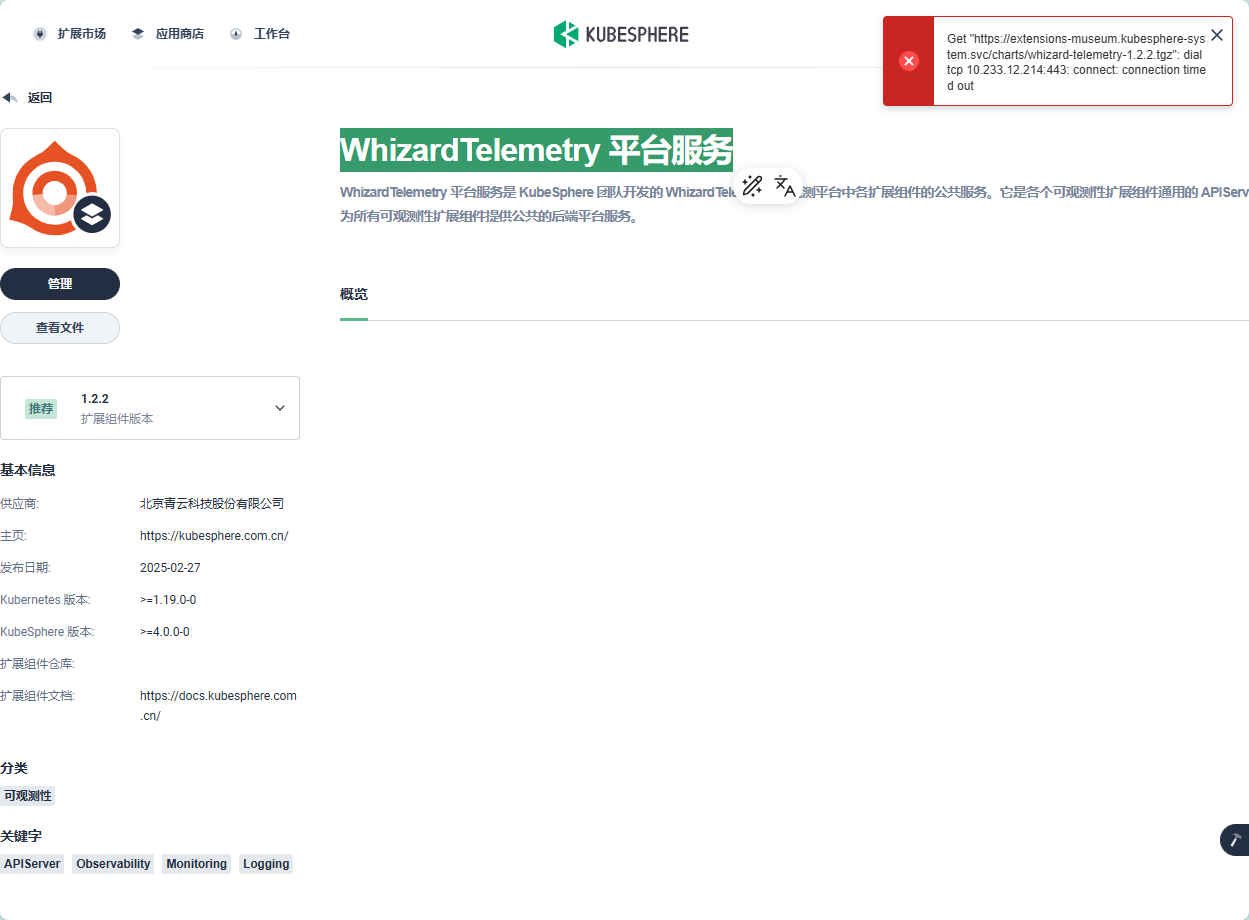
平台配置
global:
## Global image registry to use if it needs to be overriden for some specific use cases (e.g local registries, custom images, ...)
##
imageRegistry: ""
## Reference to one or more secrets to be used when pulling images
## ref: https://kubernetes.io/docs/tasks/configure-pod-container/pull-image-private-registry/
##
imagePullSecrets: []
# - name: "image-pull-secret"
# or
# - "image-pull-secret"
nodeSelector: {}
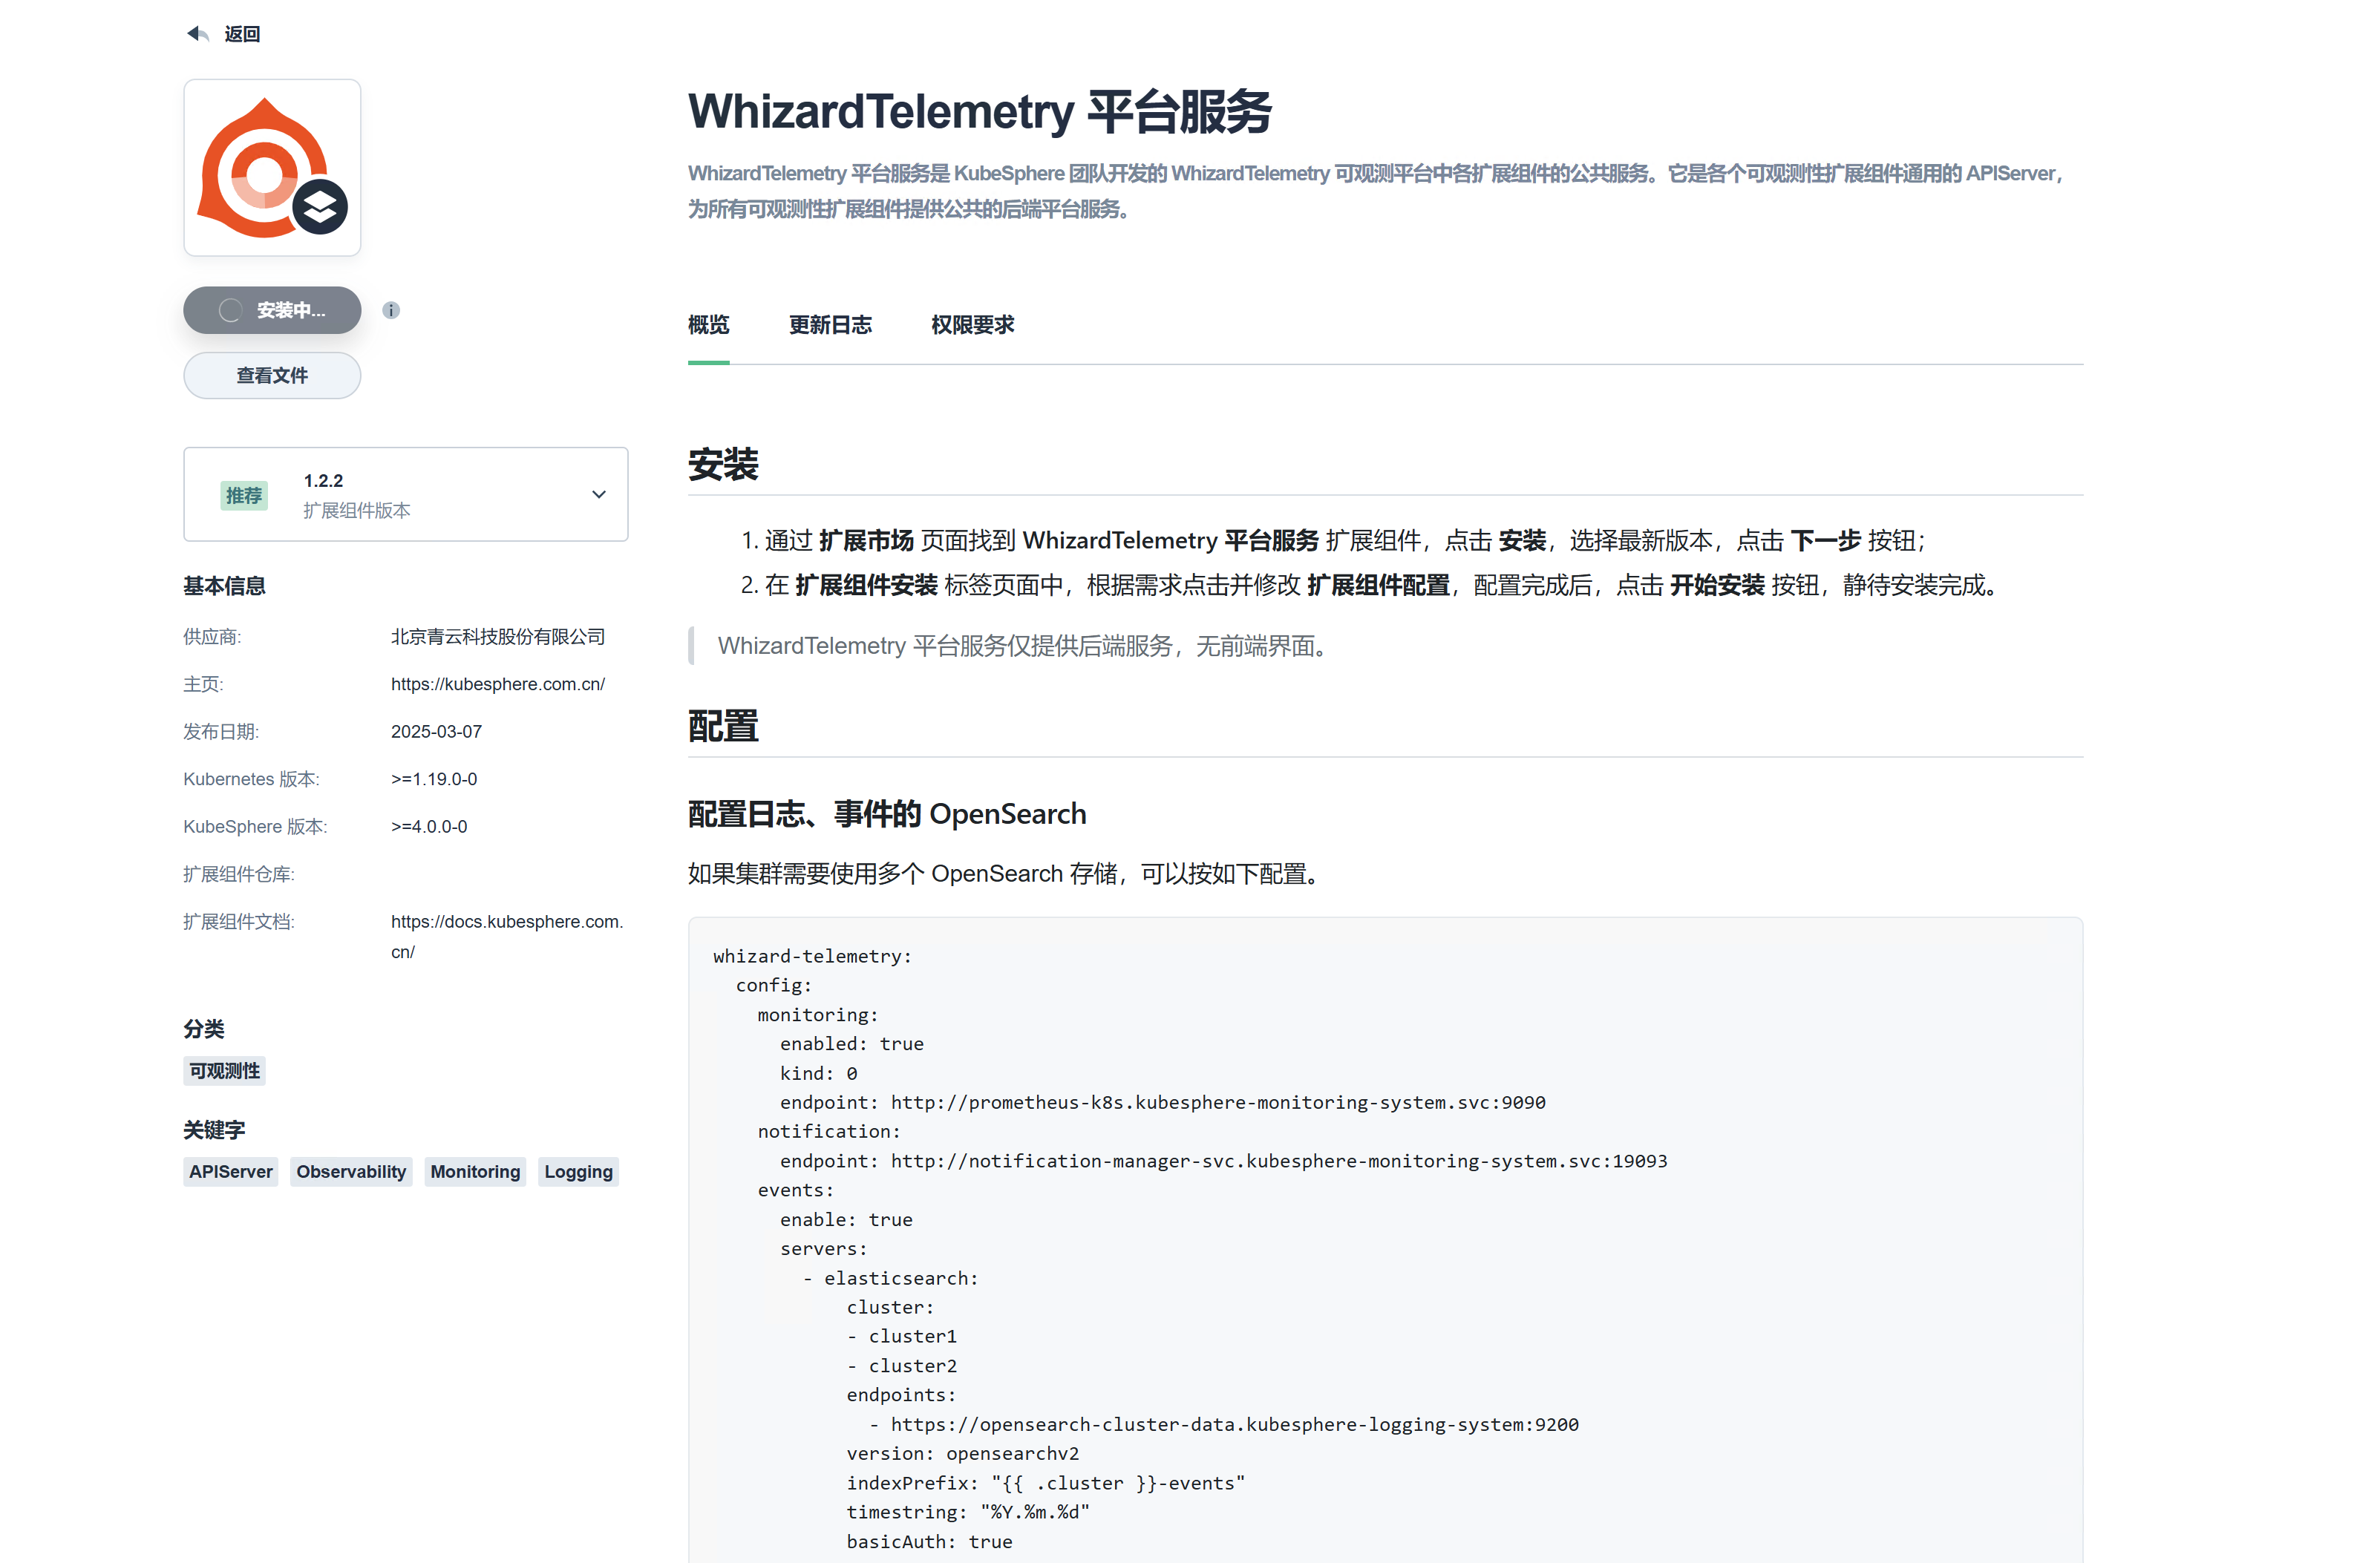
whizard-telemetry:
config:
monitoring:
enabled: true
kind: 0
endpoint: http://prometheus-k8s.kubesphere-monitoring-system.svc:9090
notification:
endpoint: http://notification-manager-svc.kubesphere-monitoring-system.svc:19093
events:
enable: true
servers:
- elasticsearch:
endpoints:
- https://opensearch-cluster-data.kubesphere-logging-system:9200
version: opensearchv2
indexPrefix: "{{ .cluster }}-events"
timestring: "%Y.%m.%d"
basicAuth: true
username: admin
password: admin
- elasticsearch:
cluster:
- wh-member
endpoints:
- https://192.168.217.35:30920
version: opensearchv2
indexPrefix: "{{ .cluster }}-events"
timestring: "%Y.%m.%d"
basicAuth: true
username: admin
password: admin
- elasticsearch:
cluster:
- bj-member
endpoints:
- https://10.21.3.7:30920
version: opensearchv2
indexPrefix: "{{ .cluster }}-events"
timestring: "%Y.%m.%d"
basicAuth: true
username: admin
password: admin
logging:
enable: true
servers:
- elasticsearch:
endpoints:
- https://opensearch-cluster-data.kubesphere-logging-system:9200
version: opensearchv2
indexPrefix: "{{ .cluster }}-{{ .kubernetes.namespace_name }}-logs"
timestring: "%Y.%m.%d"
basicAuth: true
username: admin
password: admin
- elasticsearch:
cluster:
- wh-member
endpoints:
- https://192.168.217.35:31555
version: opensearchv2
indexPrefix: "{{ .cluster }}-{{ .kubernetes.namespace_name }}-logs"
timestring: "%Y.%m.%d"
basicAuth: true
username: admin
password: admin
- elasticsearch:
cluster:
- bj-member
endpoints:
- https://10.21.3.7:30920
version: opensearchv2
indexPrefix: "{{ .cluster }}-{{ .kubernetes.namespace_name }}-logs"
timestring: "%Y.%m.%d"
basicAuth: true
username: admin
password: admin
logging配
global:
imageRegistry: ""
nodeSelector: {}
imagePullSecrets: []
clusterInfo: {}
logsidecar-injector:
enabled: true
sidecar:
sidecarType: vector
resources:
limits:
cpu: 100m
memory: 100Mi
requests:
cpu: 10m
memory: 10Mi
configReloader:
resources:
limits:
cpu: 100m
memory: 100Mi
requests:
cpu: 10m
memory: 10Mi
affinity: {}
tolerations: []
nodeSelector: {}
vector-logging:
calico:
enabled: true
logPath:
- "/var/log/calico/cni/cni*.log"
filter:
extraLabelSelector: "app.kubernetes.io/name!=kube-events-exporter"
extraNamespaceLabelSelector: ""
# When includeNamespaces and excludeNamespaces are set at the same time, only excludeNamespaces will take effect.
includeNamespaces: []
excludeNamespaces: []
sinks:
loki:
# Create loki sink or not
enabled: false
# Configurations for the loki sink, more info for https://vector.dev/docs/reference/configuration/sinks/loki/
# Usually users needn't change the following loki sink config, and the default sinks in secret "kubesphere-logging-system/vector-sinks" created by the WhizardTelemetry Data Pipeline extension will be used.
metadata:
# endpoint: http://<loki-gateway-ip>:<loki-gateway-port>
# path: /loki/api/v1/push
# encoding:
# codec: json
tenant_id: whizard-logs-ks
# out_of_order_action: accept
# remove_timestamp: false
# batch:
# max_bytes: 10000000
# timeout_secs: 5
# buffer:
# max_events: 10000
# request:
# retry_attempts: 10
labels:
- cluster="{{ .cluster }}"
- node="{{ .kubernetes.node_name }}"
- workspace="{{ .kubernetes.workspace }}"
- namespace="{{ .kubernetes.namespace_name }}"
- pod="{{ .kubernetes.pod_name }}"
- container="{{ .kubernetes.container_name }}"
opensearch:
# Create opensearch sink or not
enabled: true
# The index to store the logs, will be {{ prefix }}-{{ timestring }}
index:
# The prefix of index, supports template syntax.
prefix: "{{ .cluster }}-{{ .kubernetes.namespace_name }}-logs"
# Timestring is parsed from strftime patterns, like %Y.%m.%d. Used to distribute logs into different indexes according to time.
timestring: "%Y.%m.%d"
# Configurations for the opensearch sink, more info for https://vector.dev/docs/reference/configuration/sinks/elasticsearch/
# Usually users needn't change the following OpenSearch sink config, and the default sinks in secret "kubesphere-logging-system/vector-sinks" created by the WhizardTelemetry Data Pipeline extension will be used.
# metadata:
# api_version: v8
# auth:
# strategy: basic
# user: admin
# password: admin
# batch:
# timeout_secs: 5
# buffer:
# max_events: 10000
# endpoints:
# - https://opensearch-cluster-data.kubesphere-logging-system:9200
# tls:
# verify_certificate: false
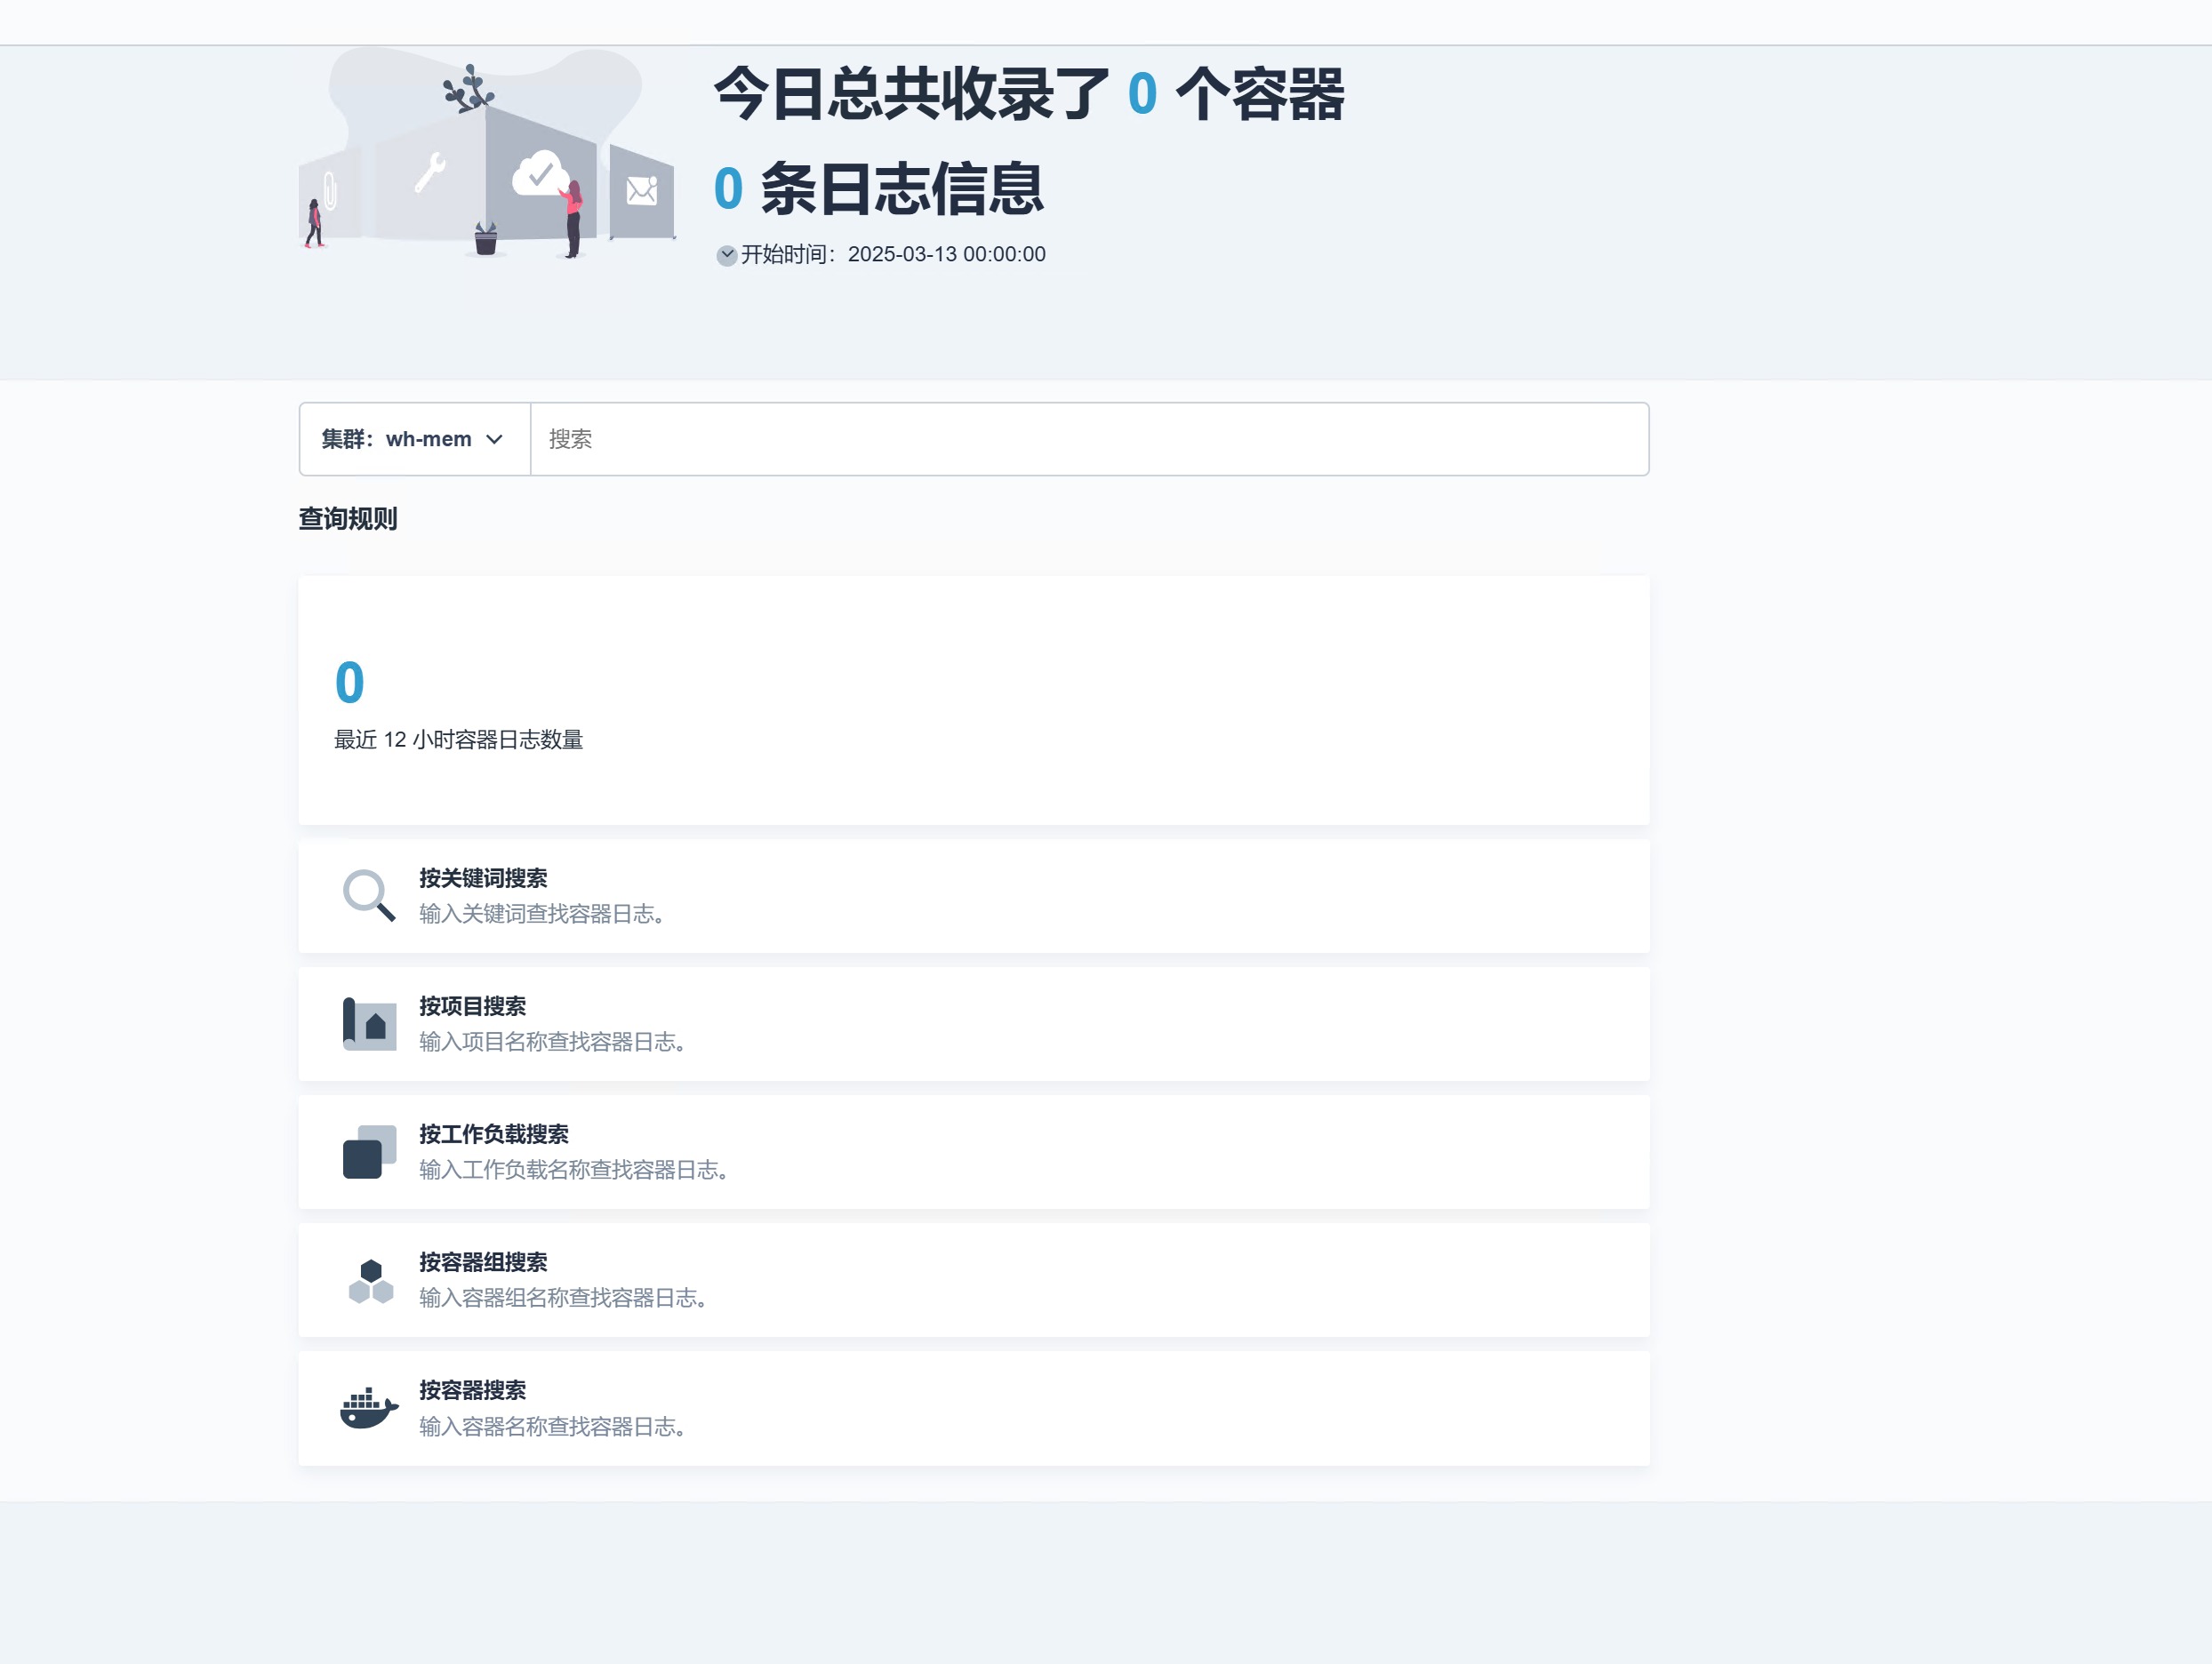
opensearch-dashboards显示成员集群的opensearch已经有数据了
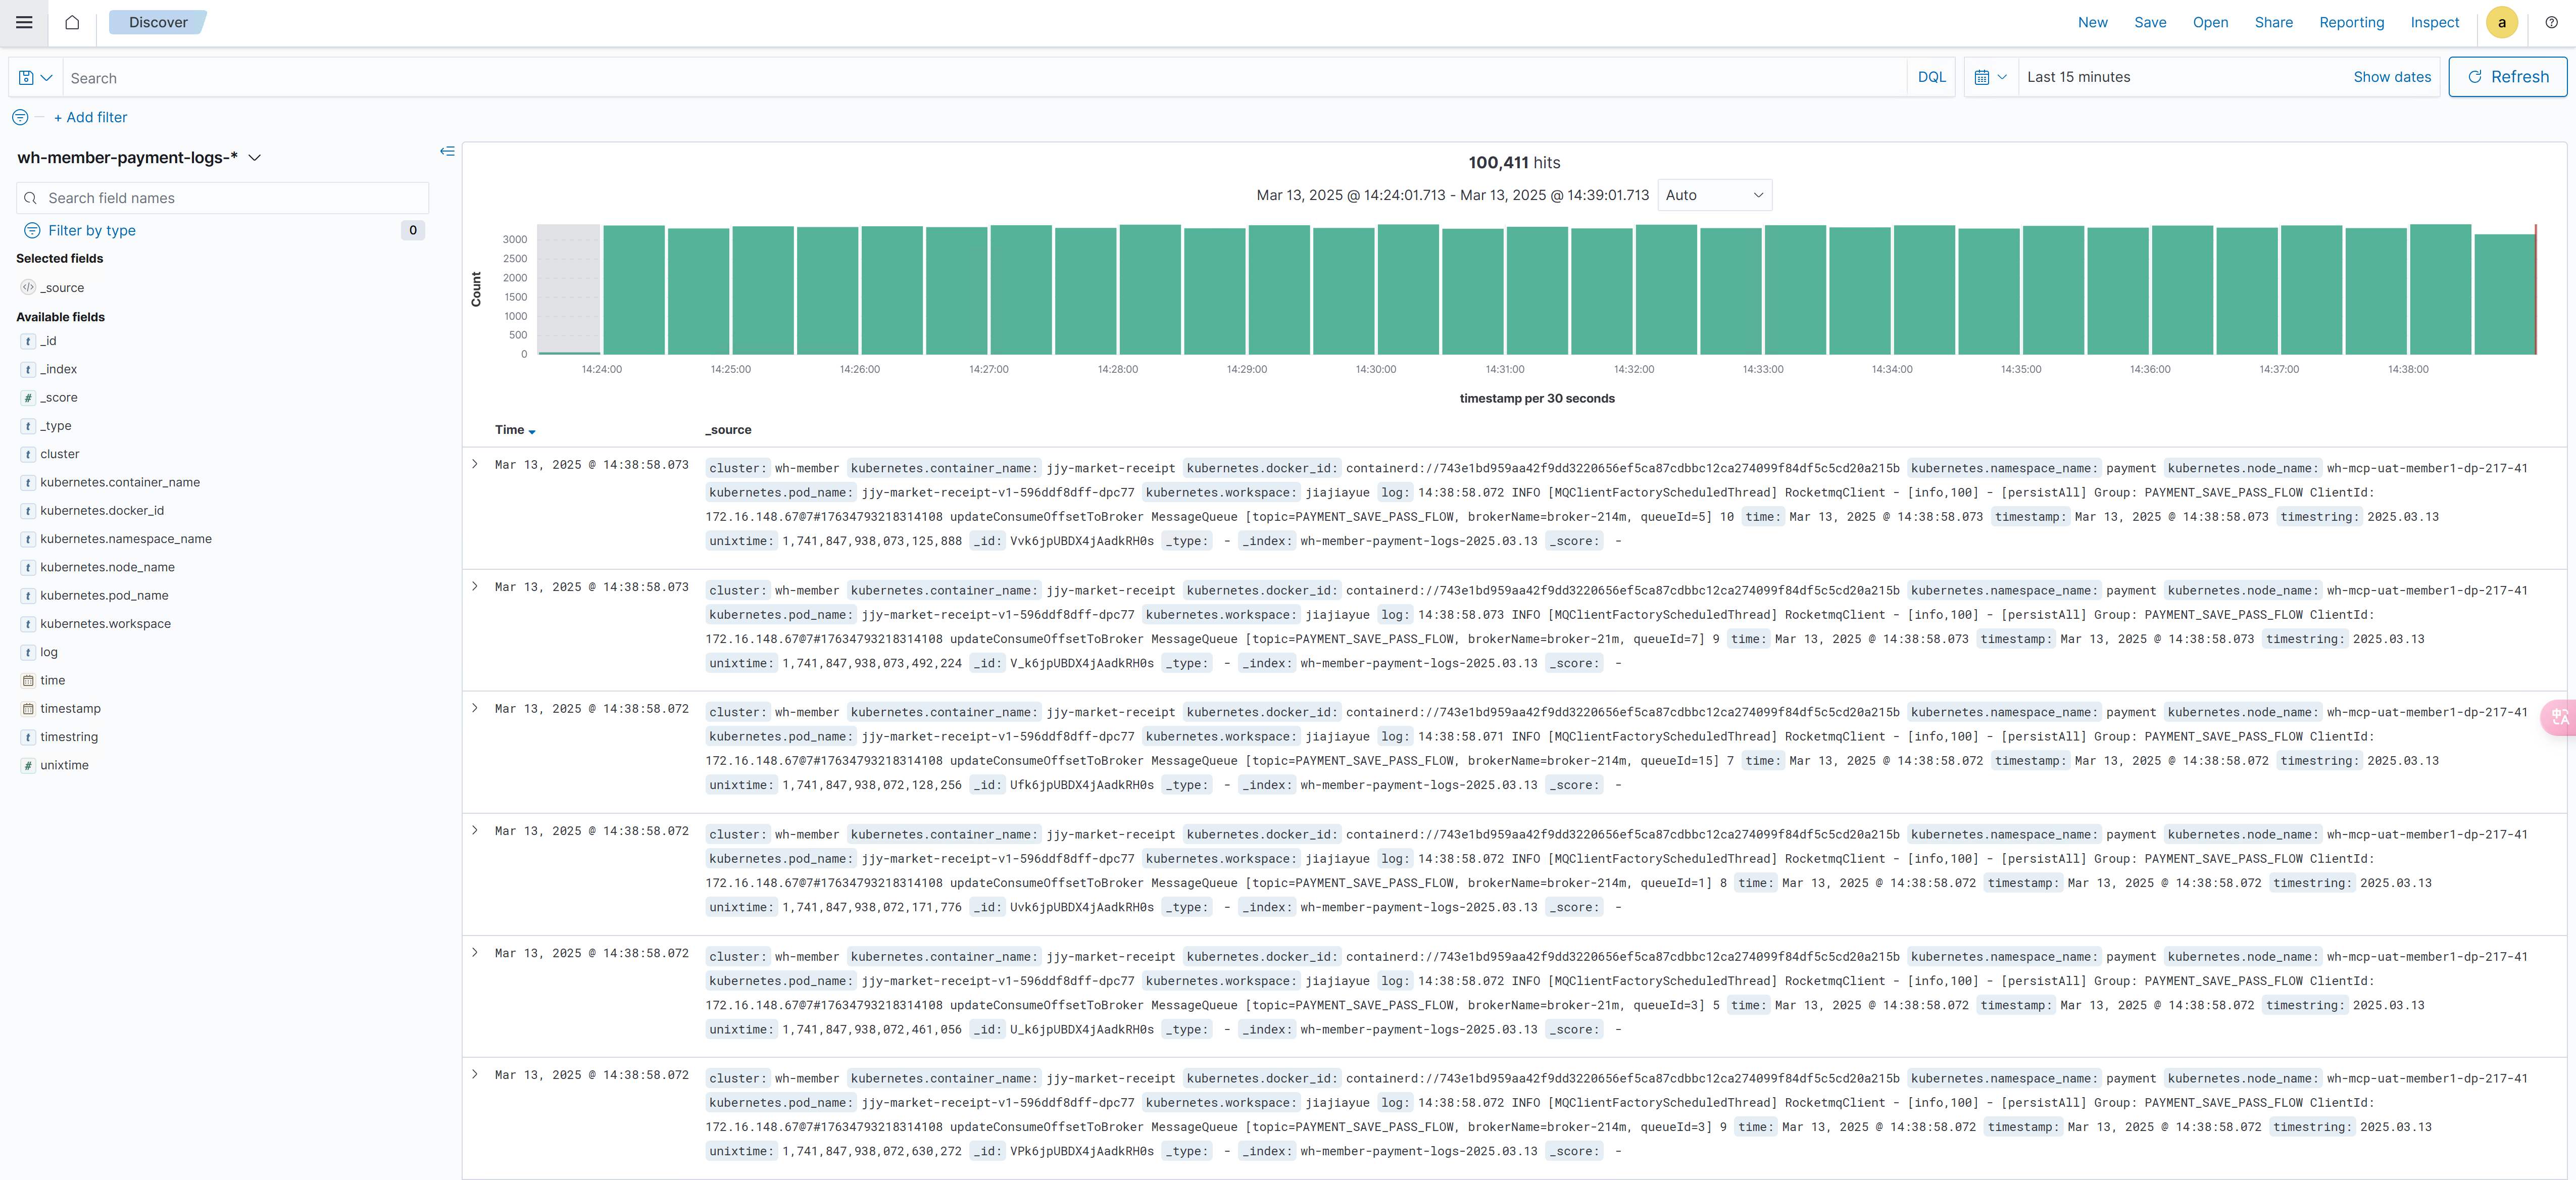
但是host集群无法看到