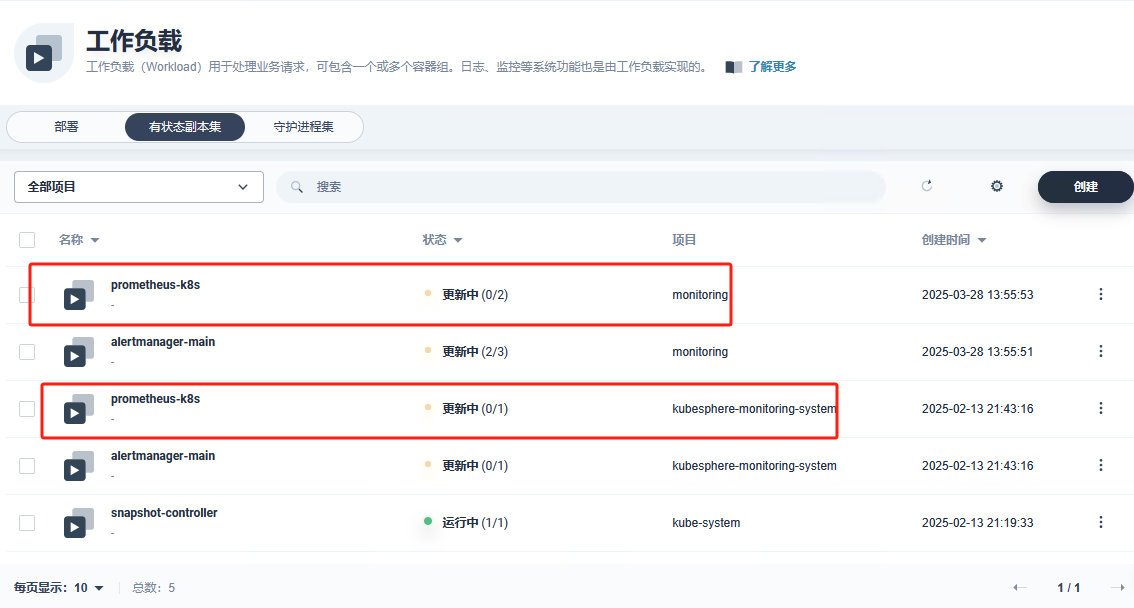
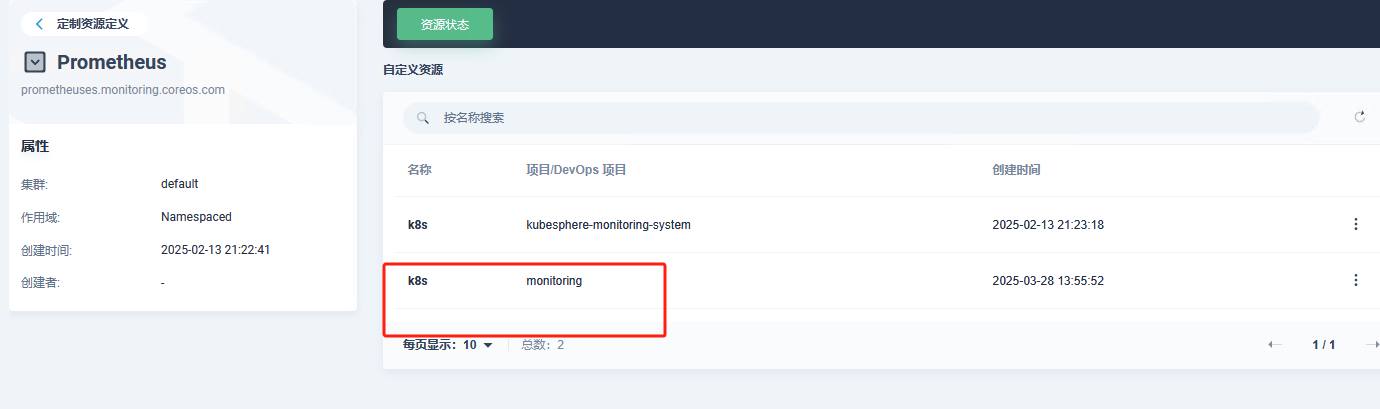
kubesphere版本是v3.4,在现有的kubesphere上已经有了kubesphere-monitoring-system,再部署另一套kube-prometheus到monitoring命名空间,参考的是https://www.qikqiak.com/k8strain/monitor/operator/install/ , 然后完成后发现2个prometheus都处于反复重启中,检查后发现是在CRD Prometheus中有2个不同命名空间的k8s,prometheus可能存在相互冲突,但又定位不到冲突点在哪里,试着改clusterrole,但是不成功。

    wangnan229 在monitoring命名空间的prometheus-operator的报错是:2025-03-28T02:37:35.426171508-04:00 level=error ts=2025-03-28T06:37:35.426088081Z caller=klog.go:116 component=k8s_client_runtime func=ErrorDepth msg="status \“monitoring/k8s\” failed: failed to update status subresource: prometheuses.monitoring.coreos.com \“k8s\” not found"

    然后在CRD Prometheus中有这个k8s

    商业产品与合作咨询