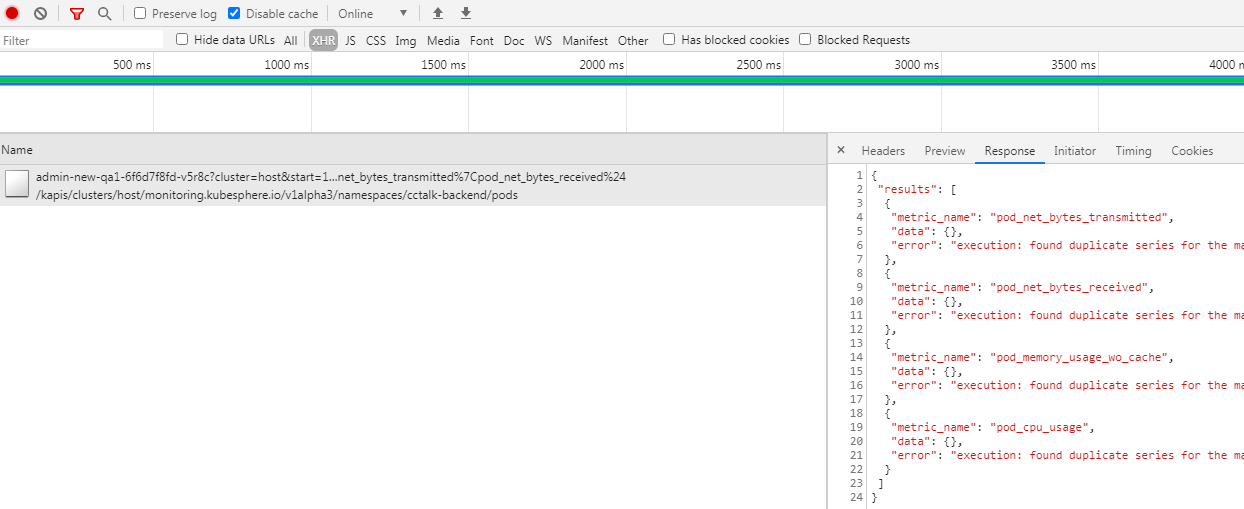
mtcc huanggze prometheus报这个错 many-to-many matching not allowed: matching labels must be unique on one side
mtcc huanggze 经过摸索问题原因找到了,因为在部署kubesphere之前,集群里面已经有prometheus-operator在运行,部署kubesphere node-expoert与已有的prometheus-operator端口冲突,无法启动,后面把node-expoert端口改了才恢复,这样集群中就同时运行着两套prometheus-operator,这就导致了同一metric数据收集了两条,只是一条多了些标签 所以查询会报错found duplicate series for the match group,many-to-many matching not allowed: matching labels must be unique on one side,后面我卸载了集群原有的prometheus-operator,所有八小时内数据可以正常拉取,八小时之前都是两套同时运行着,因此无法拉取数据 但是两套prometheus部署在不同namespace,并且挂载的不同pvc,数据为啥会混在一起冲突,这点没搞明白,请huanggze 大佬来解答一下 另外希望在pod监控项目页面里面加上磁盘io项目,这样pod监控就完善了
huanggze mtcc 这可能是 kubesphere-monitoring-system 下的 prometheus 也同时 select 到了你的 namespace 下的全部 servicemonitor,造成冲突、重复采集监控数据。 请确认是否是这种情况? 现在你移除了你的 Prometheu Operator,这种问题应该不会存在了
mtcc huanggze 对的 是这种情况prometheus console数据当时没截图 看数据的确是多了之前部署的Prometheu Operator的标签 现在现场没了 昨天删除之前的Prometheu Operator问题已经得到解决
mtcc huanggze 希望在pod监控项目页面里面加上磁盘io项目,这样pod监控就完善了 container_fs_writes_bytes_total 等一些关于pod的disk io的metrics值在kubesphere的prometheus console里面查询没有 是什么情况 ,能否加上 ,或者自己想加该如何添加