相关组件说明
- Istio:实现流量治理
- Jaeger:实现流量Tracing (elasticSearch存储数据,默认保留7天)
- Kiali: 流量拓扑及可视化 (查询prometheus)
1. 前提
首先检查相应的pod是否正常
# kubectl -n istio-system get pod
NAME READY STATUS RESTARTS AGE
istiod-1-6-10-56f44db495-wjlpg 1/1 Running 0 8h
jaeger-collector-76bf54b467-5rv76 1/1 Running 0 8h
jaeger-operator-549999754f-d5m98 1/1 Running 0 8h
jaeger-query-b478c5655-twq7l 2/2 Running 0 8h
kiali-7965bdbc4c-kj76l 1/1 Running 0 7h18m
kiali-operator-istio-system-76f45c55f9-bhr7c 1/1 Running 0 8h
且负载已经注入sidecar
NAME READY STATUS RESTARTS AGE
details-v1-7d78fc5688-jmw6z 2/2 Running 0 8h
productpage-v1-844495cb4b-zjtv5 2/2 Running 0 8h
ratings-v1-55ccf46fb4-x8kqb 2/2 Running 0 8h
reviews-v1-68bb7b8c4f-kj7k4 2/2 Running 0 8h
注意:先保证bookinfo正常,再调试自制应用。bookinfo能反应系统健康状况;bookinfo不正常,说明系统配置或是组件有问题;bookinfo正常,自制应用不正常,说明自己的应用设置不正确,系统组件无问题
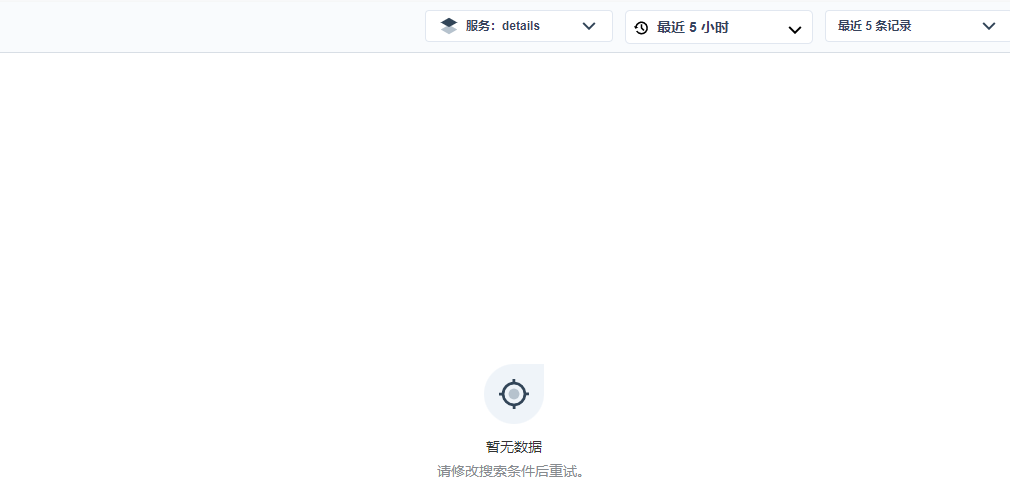
2. Tracing 不正常排查步骤
1) 项目高级功能中,需要开启网关功能,并打开流量治理开关。
即kubesphere-controls-system ingress controller需要注入sidecar;且添加相应路由,即ingress,保证流量入口匹配该路由规则。
2) 检查es是否正常
a. 查看kubesphere-logging-system下的es pod是否正常
kubectl -n kubesphere-logging-system get po | grep data
elasticsearch-logging-data-0 1/1 Running 1 19d
elasticsearch-logging-data-1 1/1 Running 1 19d
b. curl es_data_IP:9200/_cat/indices | grep jaeger 看panel相关的数据是否存在
# kubectl get svc -n kubesphere-logging-system
NAME TYPE CLUSTER-IP EXTERNAL-IP PORT(S) AGE
elasticsearch-logging-data ClusterIP 10.233.51.57 <none> 9200/TCP
# curl 10.233.51.57:9200/_cat/indices|grep jaeger
green open logstash-jaeger-service-2020-12-15 S4gVJYsKQ265-f_5zUER3g 5 1 21 0 122.1kb 59.4kb
c. 检查es数据盘是否已经存满,变只读
jaeger-collector中有相关的报错log:

页面查看logging-data盘已满
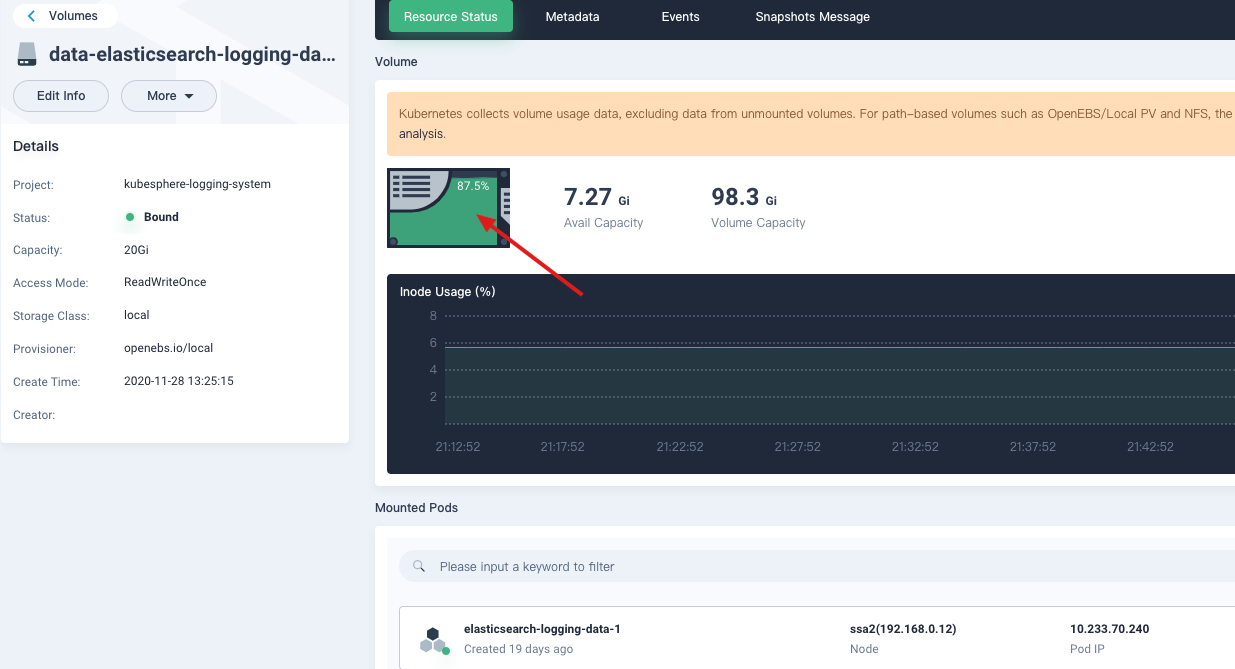
处理方法:扩盘或是删除部分数据(生产谨慎操作)
进入elasticSearch data POD
# kubectl -n kubesphere-logging-system exec -ti elasticsearch-logging-data-0 sh
删除index数据

d. 可以手动请求中带上相应Header,查看该请求能否正常Tracing
curl productpageIP:9080 -H 'X-Request-ID: 56955ffa-4000-9e1e-bd53-50a41b825ea0'
如果这个有数据,说明Tracing功能其实是正常的,请求进来时,未加Header,或是未经过Ingress(经过nginx ingress后,会自动给它加上RequestID
e. 如果以上都不能解决问题,下面提供终极解决办法:
直接使用内存来存储数据,来快速定位问题:
kubectl -n istio-system patch jaeger jaeger -p '{"spec": {"strategy":"allInOne"}}' --type=merge
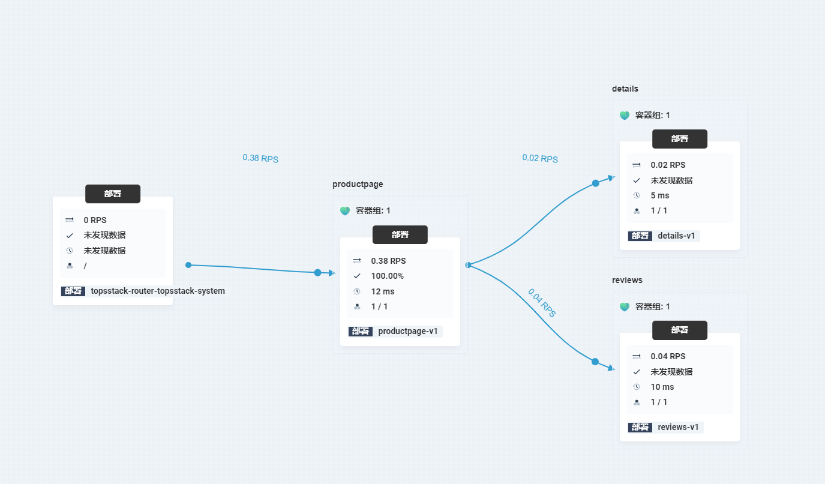
3.流量拓扑图不正常排查步骤
- 检查prometheus是否正常
kubectl -n kubesphere-monitoring-system get pod | grep prometheus
- 暴露Prometheus服务
将prometheus的service改成NodePort
kubectl -n kubesphere-monitoring-system edit svc prometheus-k8s # 修改为NodePort
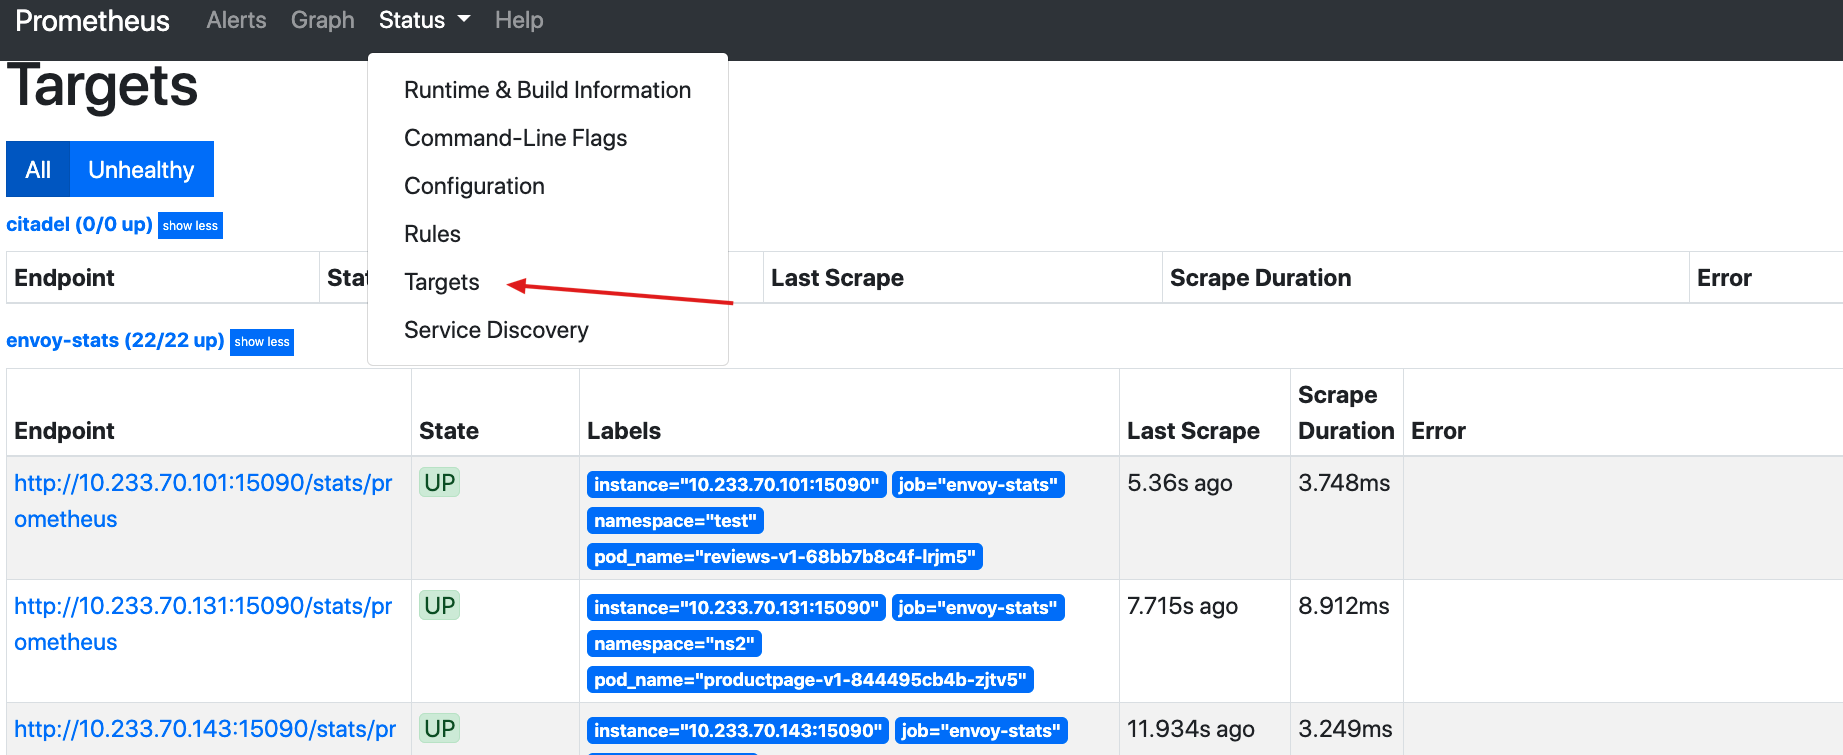
- 页面查看是否有不正常targets
4 PromQl来查询istio_requests_total是否有值
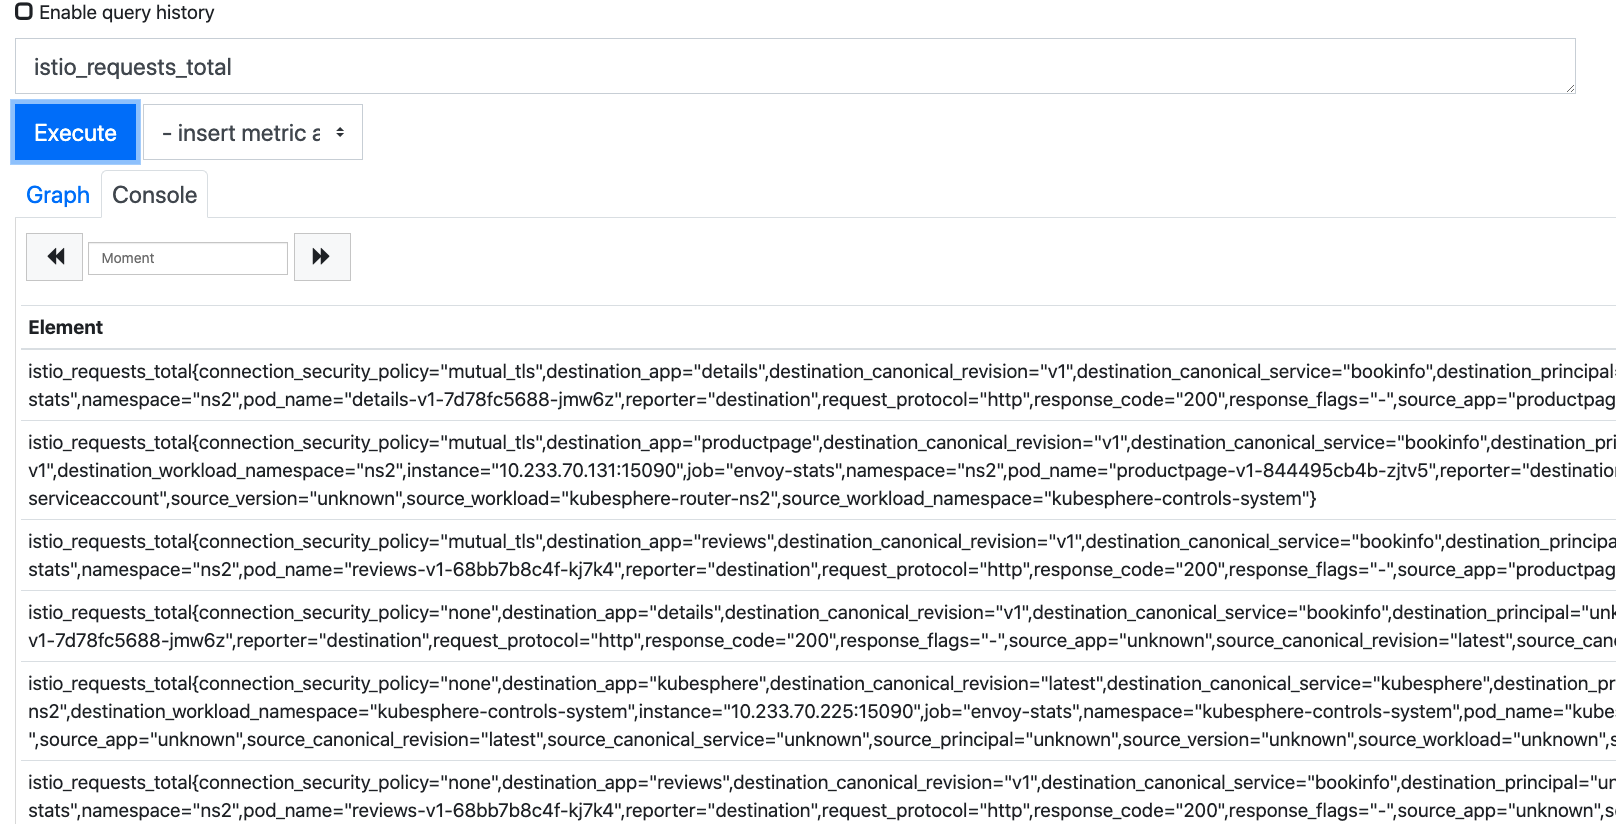
- 如果某个服务没有监控数据,可以直接curl该pod的端口,看下监控是否正常
curl podIP:15090/stats/prometheus
4. 调整Tracing采样周期
Jaeger默认配置会对每次的请求采样记录,对cpu/内存/存储都有一定消耗,可以调整采样周期来解决。如下:采样率调整为50%
kubectl patch jaeger jaeger --type=merge -p '{"spec":{"sampling":{"options":{"default_strategy":{"type":"probabilistic","param":"50"}}}}}'
5. 备份Istio相关的所有的资源
根据Istio的crd,检索出所有的istio相关的资源,如virtualservice、destinationrules等
kubectl get crds | grep 'istio.io' | cut -f1-1 -d "." | \
xargs -n1 -I{} sh -c "kubectl get --all-namespaces -o yaml {}; echo ---" > $HOME/ISTIO_RESOURCE_BACKUP.yaml
6. 备份某个Namespace下的application下的资源
备份某个namespace下的application及其子资源:
for i in `kubectl -n ${your_namespace} get app bookinfo -oyaml | grep -i link | awk '{print $(NF)}'`;do kubectl get --raw ''$i'' | jq >> sample-bookinfo.json.20201123.bak; >> sample-bookinfo.json.20201123.bak; done
7. application CRD版本升级
从ks3.1及之后的版本,要求CRD版本升级,否则流量拓扑不正常。
如果无法使用 kubectl get app命令,说明需要升级,升级方法:
kubectl apply -f https://raw.githubusercontent.com/kubesphere/ks-installer/master/roles/common/files/ks-crds/app.k8s.io_applications.yaml
9. 如何注入sidecar?
kubesphere自带的istio自动注入是不需要对ns加label的
修改deployment中的template 中 annotation
template:
metadata:
annotations:
sidecar.istio.io/inject: "true"
10.所有 init 容器反复重启
现象:所有注入sidecar的pod全部显示CrashOff,init容器反复重启
kubernetes/kubernetes#86531 k8s的问题
因为init container完成就是stop状态了,docker system prune会把stop状态的container清除了,而kubelet又是依赖init在不在来判断init container又没有启动过,kubelet发现init container没了就会重启init
11.微服务按Header无法实现分流
解决方法:
网关注入sidecar
Ingress需要打上annotation: nginx.ingress.kubernetes.io/upstream-vhost: web-mall.cpay.svc.cluster.local
相关issue
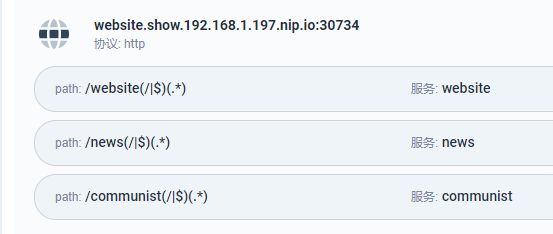
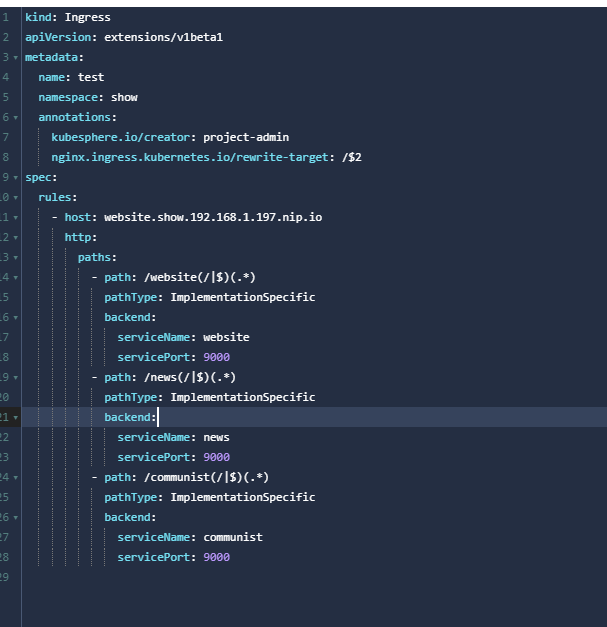
12 关于nginx ingress重定向目录404
如果path的根路径“/”,外网访问是正常的,但是如果指定一个其他路径如“/test1/”,则访问报404的错误
这个问题是Rewrite Target的问题,需要重定向目录, https://kubernetes.github.io/ingress-nginx/examples/rewrite/
Route PATH写上:
PATH: /something(/|$)(.*)
Annotation: nginx.ingress.kubernetes.io/rewrite-target: /$2
对应的Nginx的conf如下:
location ~* "^/test1(/|$)(.*)" {
set $namespace "flame";
set $ingress_name "nginx";
set $service_name "nginx";
set $service_port "80";
13.重定向设置成功,页面能够正常跳转,但是静态文件,如css js image等全部无法显示
原因:
右键看网页源码,会发现静态文件是相对地址:
<link rel="stylesheet" type="text/css" href="css/style.css">
< img src="images/AcmeAir.png" alt="Acme Air"/><br/>
通过上面的的设置Rewrite后,如rewrite test1后,访问 192.168.0.12:8080/test1 会转发请求到service,但是css/js/image,还是会取相对地址,转发到 192.168.0.12:8080/css/style.css。这就有问题,正确的应该是:192.168.0.12:/test1/css/style.css,才会转发到后端的服务上,否则只是转发到nginx。
此时另外需要加以下annotation来解决:
nginx.ingress.kubernetes.io/configuration-snippet: |
rewrite ^/static/(.*)$ /acmeair/static/$1 redirect;
这个操作是匹配静态文件rewrite。
通过这个命令,可以任意对nginx的config配置文件改写,不用局限于ingress nginx 官方的annotation。
14. 关于App Root的问题:
annotaion:nginx.ingress.kubernetes.io/app-root: /app1
是把http://stickyingress.example.com/改成 http://stickyingress.example.com/app1
https://kubernetes.github.io/ingress-nginx/examples/rewrite/#app-root
15. 如何给nginx ingress的nginx自定义配置
设置自定义配置,如设置proxy_pass等_
https://kubernetes.github.io/ingress-nginx/user-guide/nginx-configuration/annotations/#server-snippet
16. 网关开启servicemesh时,无法获取真实IP(前端传入的X-Forwarded-For中的IP被覆盖).
需要给ingress controller的cm中加上如下data:
kubectl -n kubesphere-controls-system edit cm kubesphere-router-xxx
...
data:
use-forwarded-headers: "true"
然后重启这个pod
https://kubernetes.github.io/ingress-nginx/user-guide/nginx-configuration/configmap/
验证 curl 192.168.0.12:30080 -HX-Forwarded-For:1.2.3.4
此时可以透传Header中的外部IP。
然后添加以下envoyfilter
kubectl apply -f - <<EOF
apiVersion: networking.istio.io/v1alpha3
kind: EnvoyFilter
metadata:
annotations:
name: use-remote-adress
namespace: istio-system
spec:
configPatches:
- applyTo: NETWORK_FILTER
match:
context: SIDECAR_OUTBOUND
listener:
filterChain:
filter:
name: envoy.http_connection_manager
patch:
operation: MERGE
value:
typedConfig:
'@type': type.googleapis.com/envoy.config.filter.network.http_connection_manager.v2.HttpConnectionManager
skip_xff_append: false
use_remote_address: true
xff_num_trusted_hops: 10
EOF
效果:
curl ssa3:30346/ip -HHost:www.httpbin.com
{
"origin": "127.0.0.1,10.233.64.110"
}
如果还不能满足要求:
可以使用qingcloud lb的功能
17. 关于熔断与Tracing
要求service portName要以http http2 grpc来开头
TCP是没有熔断的,熔断目前http才有,主要是针对http错误码的配置
TCP是没有自动调用链的,sidecar在调用时,如果是TCP他也没办法帮你注入trace信息
即使切换为HTTP或GRPC,应用也需要透传,否则这个也串不起来
18. KubeSphere 3.1.0中istio 的bug
- HPA
root@ssa:/root # kubectl -n kube-system logs -f kube-controller-manager-ssa
# 报错日志
E0428 18:15:25.675662 1 horizontal.go:214] failed to query scale subresource for Deployment/istio-system/istiod: deployments/scale.apps "istiod" not found
原因 istio 1.6.10 为了采用canary 方式安装与升级。deplyment 名字会加上-1-6-10,而istio hpa仍是原先的deploy/istiod。修复方法:
手动执行如下命令修复:
kubectl -n istio-system patch hpa istiod-1-6-10 --type merge --patch '{"spec":{"scaleTargetRef":{"name":"istiod-1-6-10"}}}'
- webhook
root@ssa:/root # k get validatingwebhookconfigurations.admissionregistration.k8s.io istiod-istio-system -oyaml
service:
name: istiod
namespace: istio-system
path: /validate
port: 443
failurePolicy: Igno
# kube-apiserver报错
E0506 15:21:19.001919 1 dispatcher.go:129] failed calling webhook "validation.istio.io": Post https://istiod.istio-system.svc:443/validate?timeout=30s: service "istiod" not found
修复方式
➜ ~ k get validatingwebhookconfigurations.admissionregistration.k8s.io istiod-istio-system -oyaml | sed 's/name: istiod$/name: istiod-1-6-10/' | kubectl replace -f -
3.按header灰度时无法保存配置。 kubesphere/kubesphere#3845
19. istio-system namespace删除时一直terminating的处理方式
ks 3.1.0开始会部署kiali pods。直接使用Kiali提供的api,改掉了之前在ks-apiserver中直接集成kiali代码的方式。
在卸载istio相关组件的时候,最暴力的方法,就是直接把这个ns删除掉,同时删除webhook。如:
kubectl delete mutatingwebhookconfigurations istio-sidecar-injector-1-6-10
kubectl delete validatingwebhookconfigurations istiod-istio-system
kubectl delete ns istio-system
但是在删除ns的时候,istio-system会一直terminating中。原因是kiali的cr没有删除干净,这个是已知的issue。
需要执行以下命令:
kubectl patch kiali kiali -n istio-system -p '{"metadata":{"finalizers": []}}' --type=merge