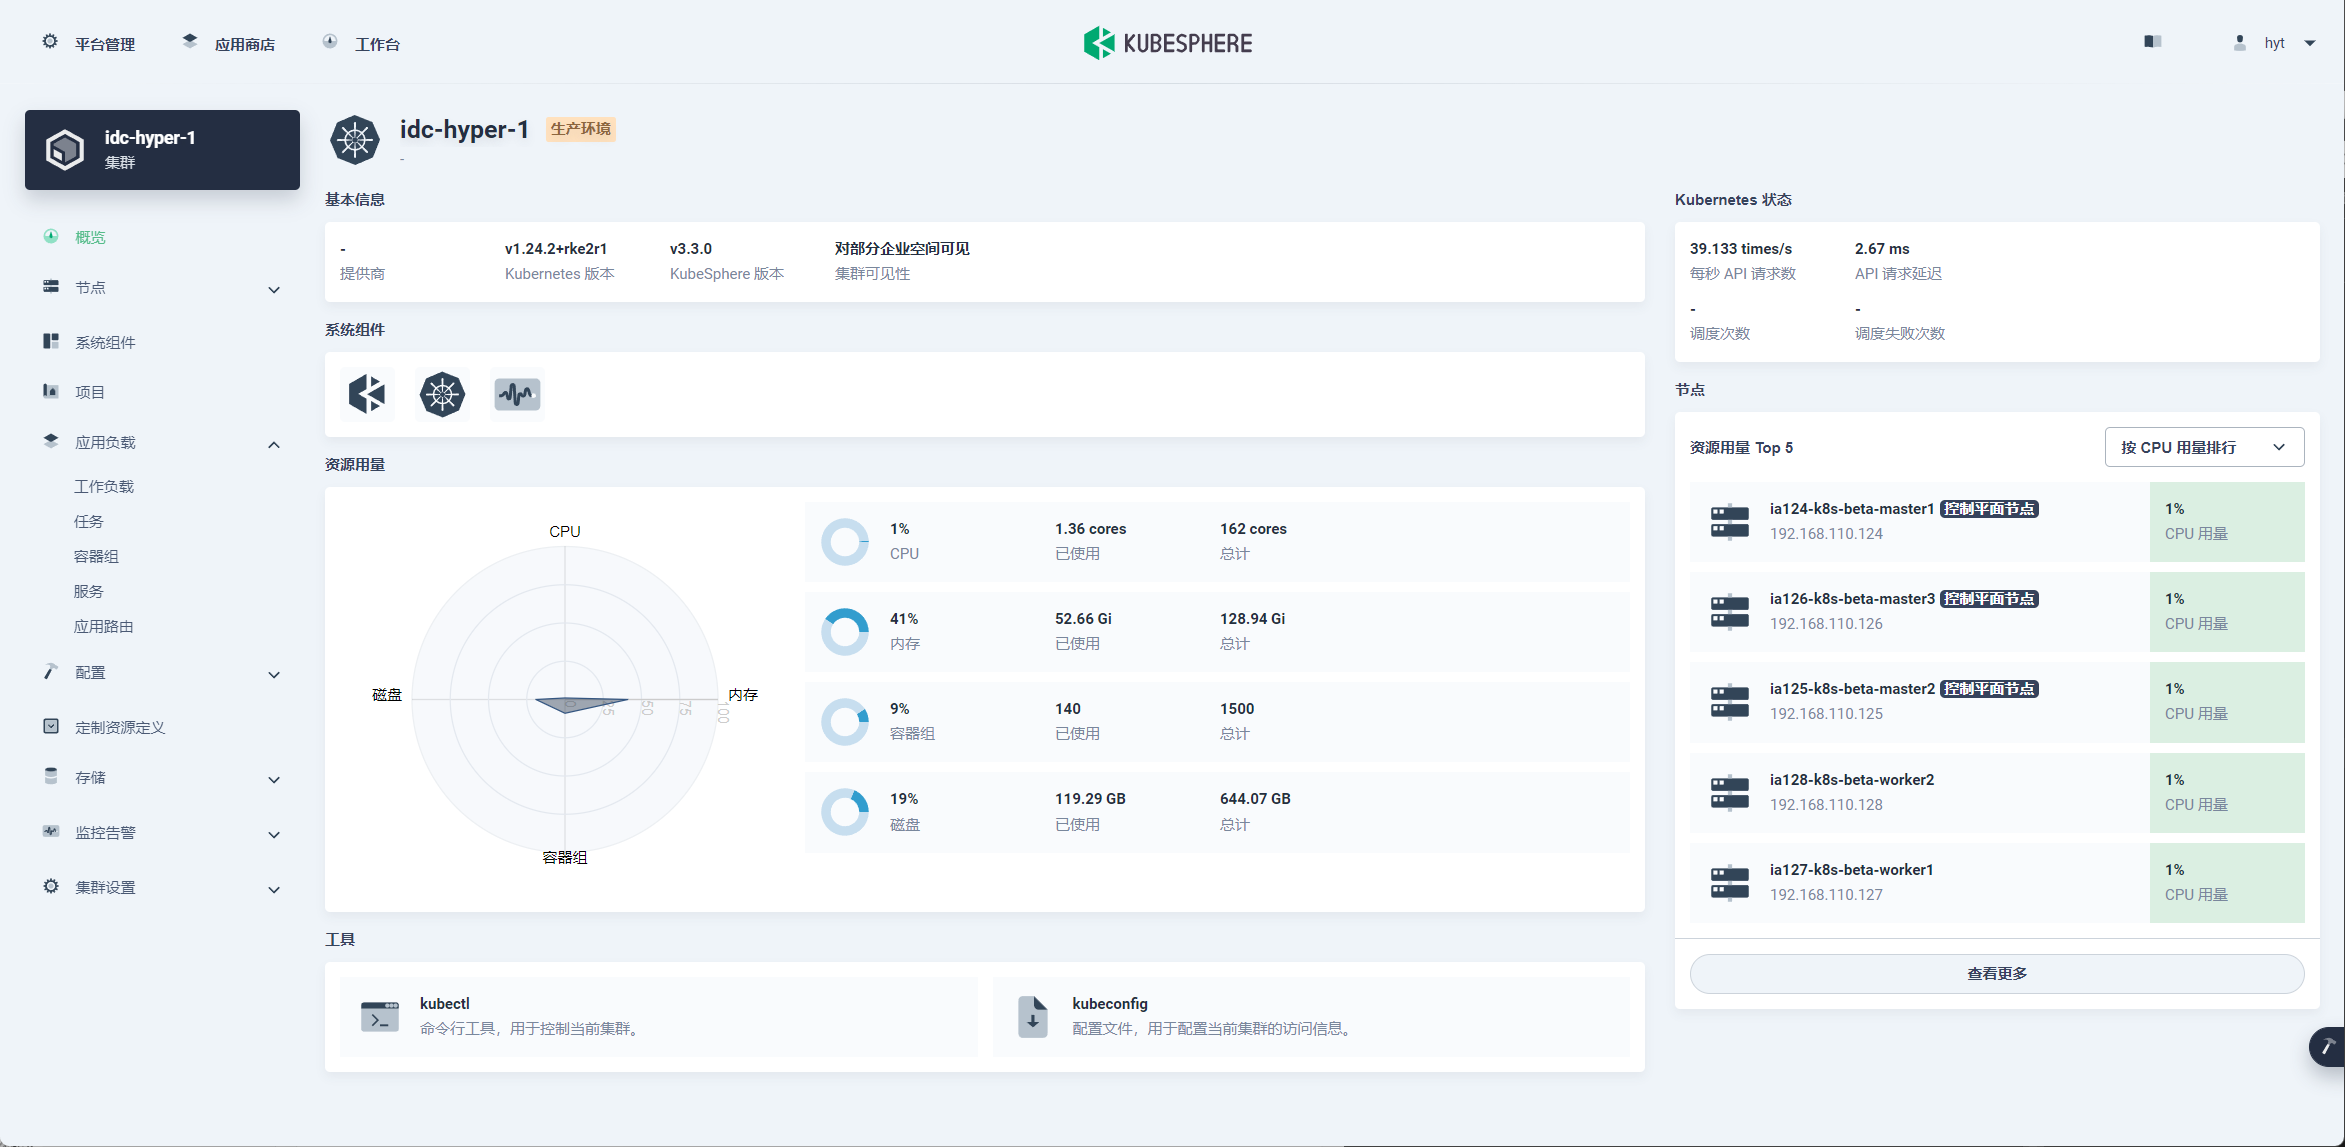
集群概览正常显示
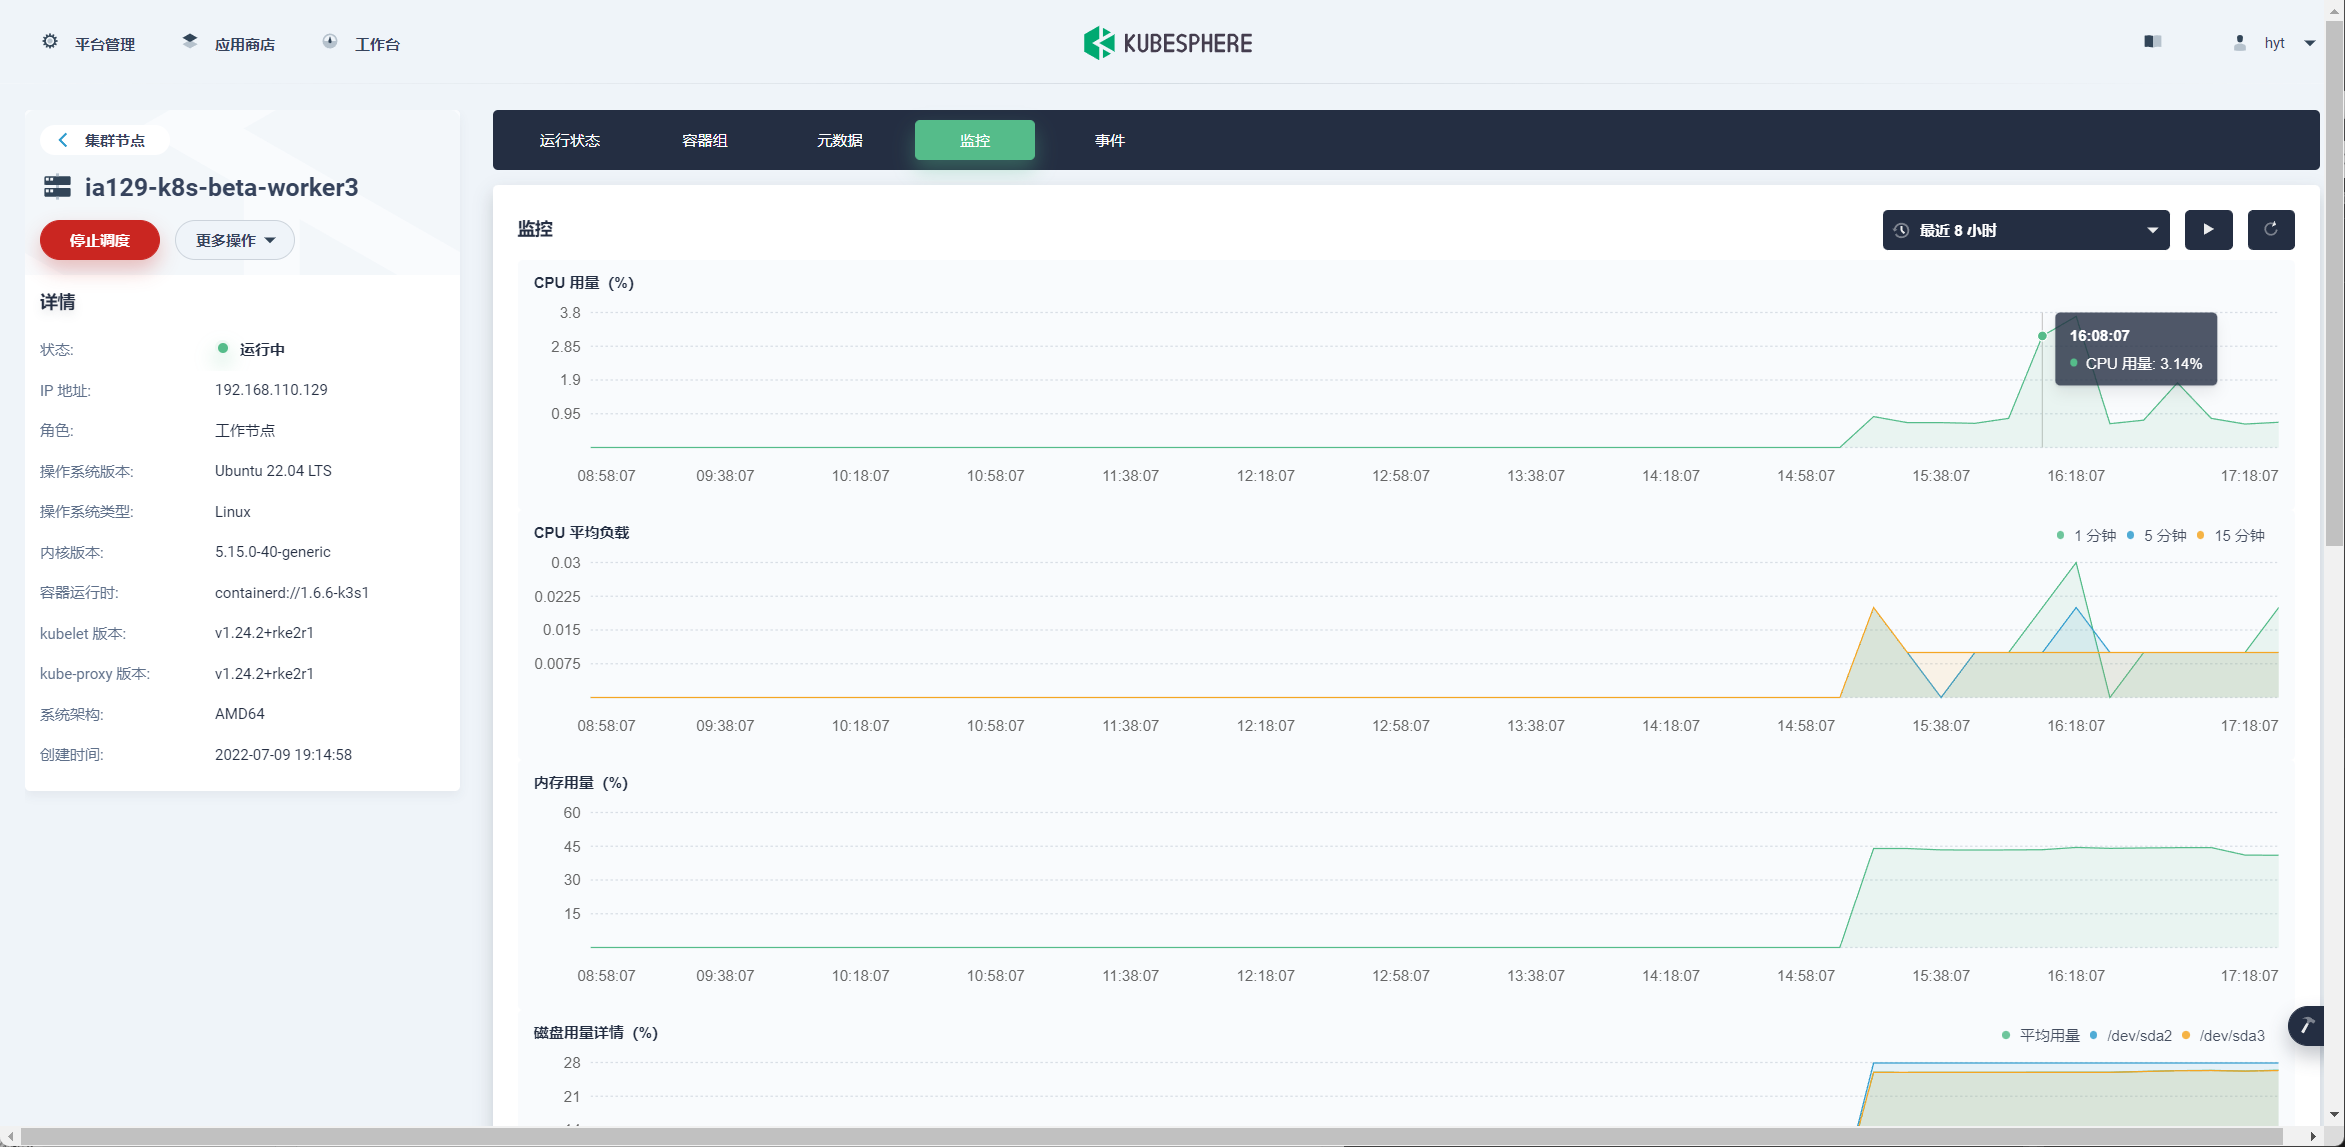
节点监控指标显示正常
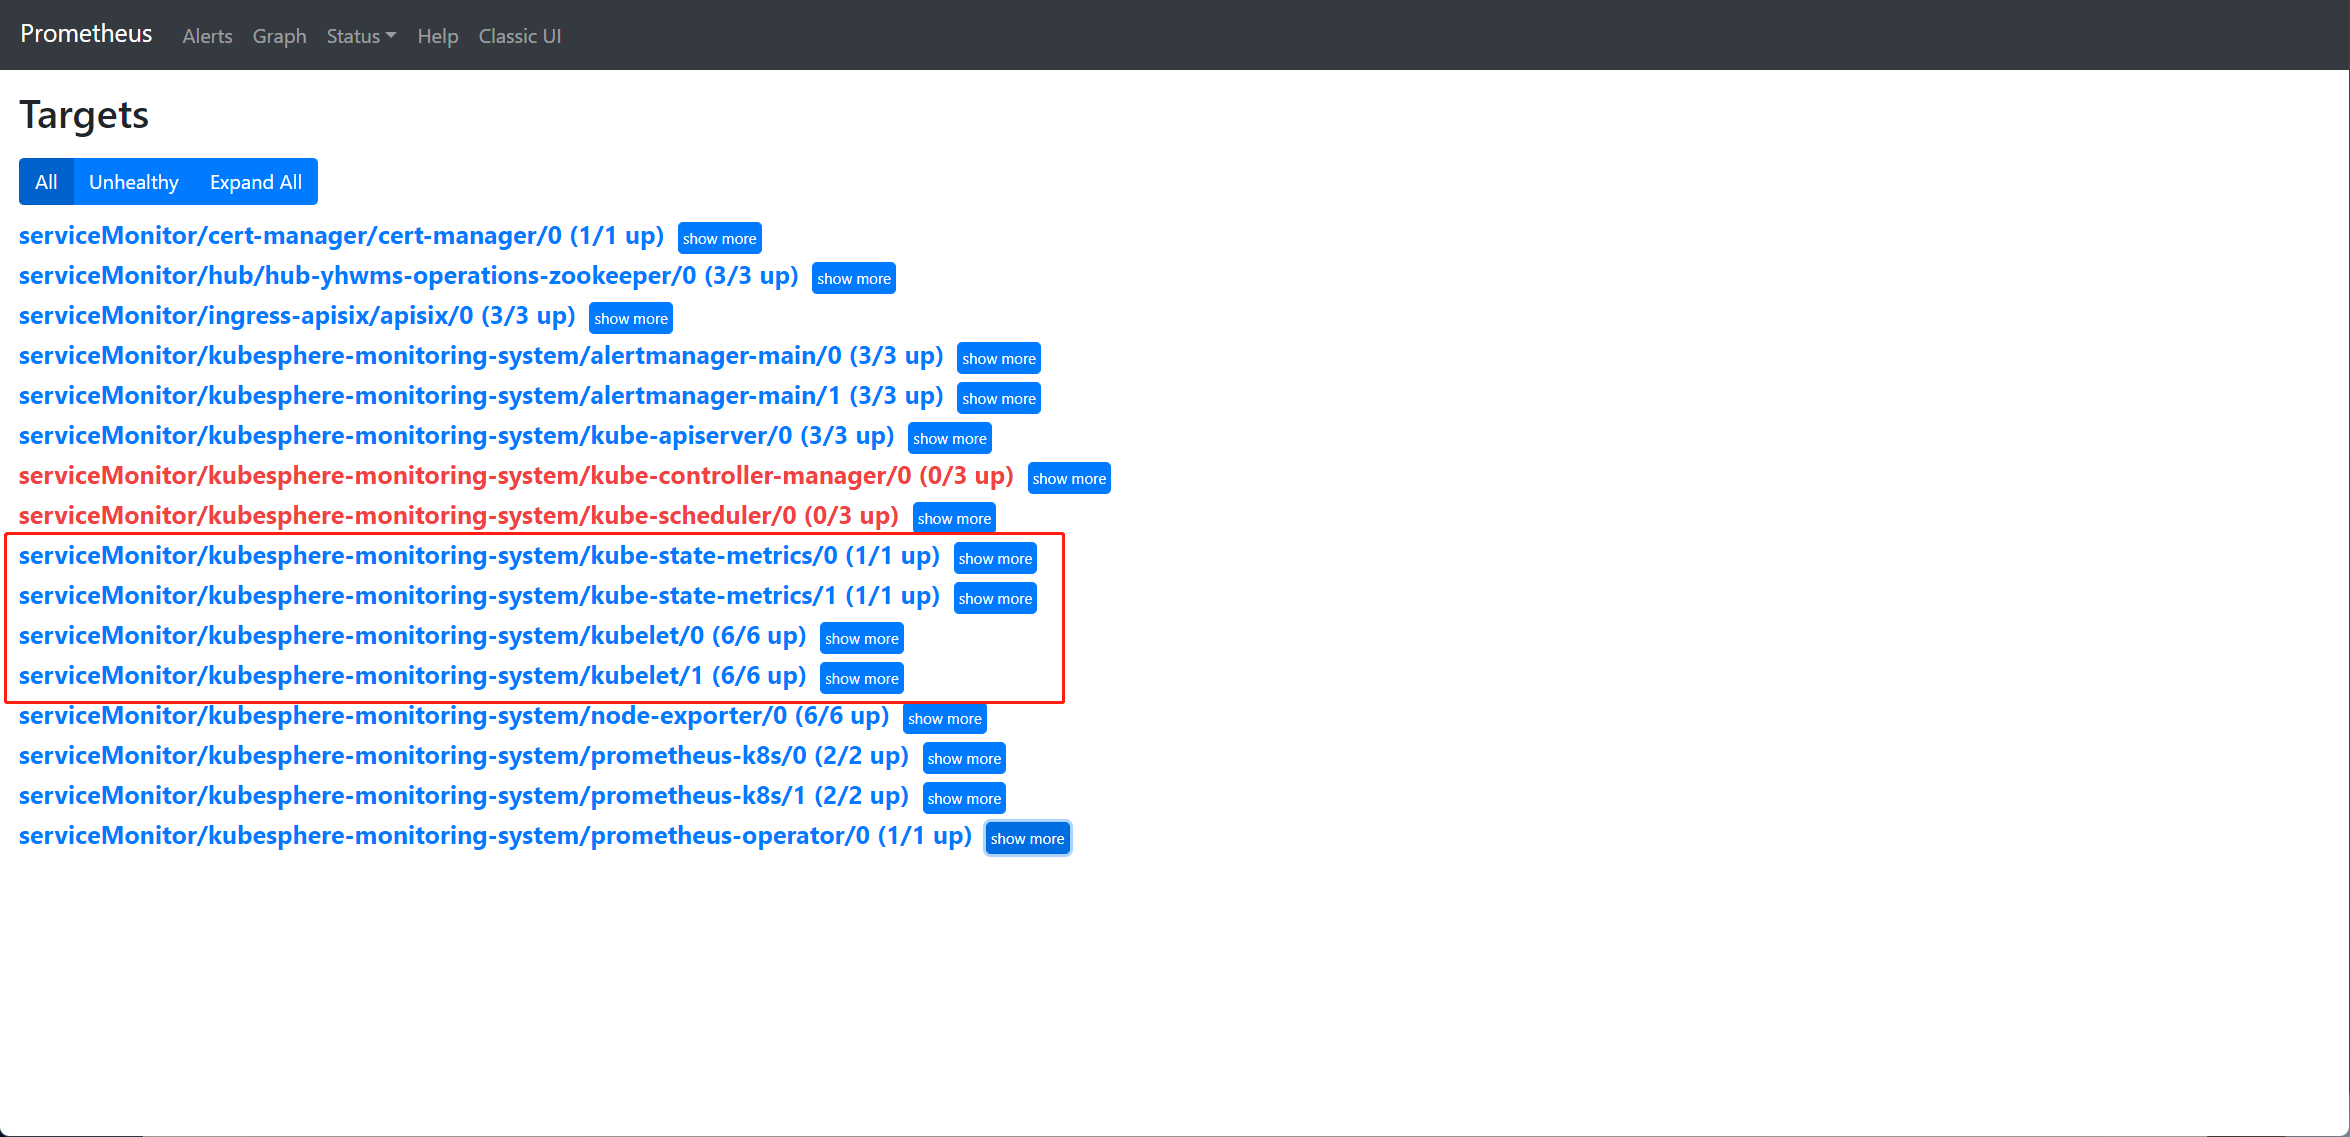
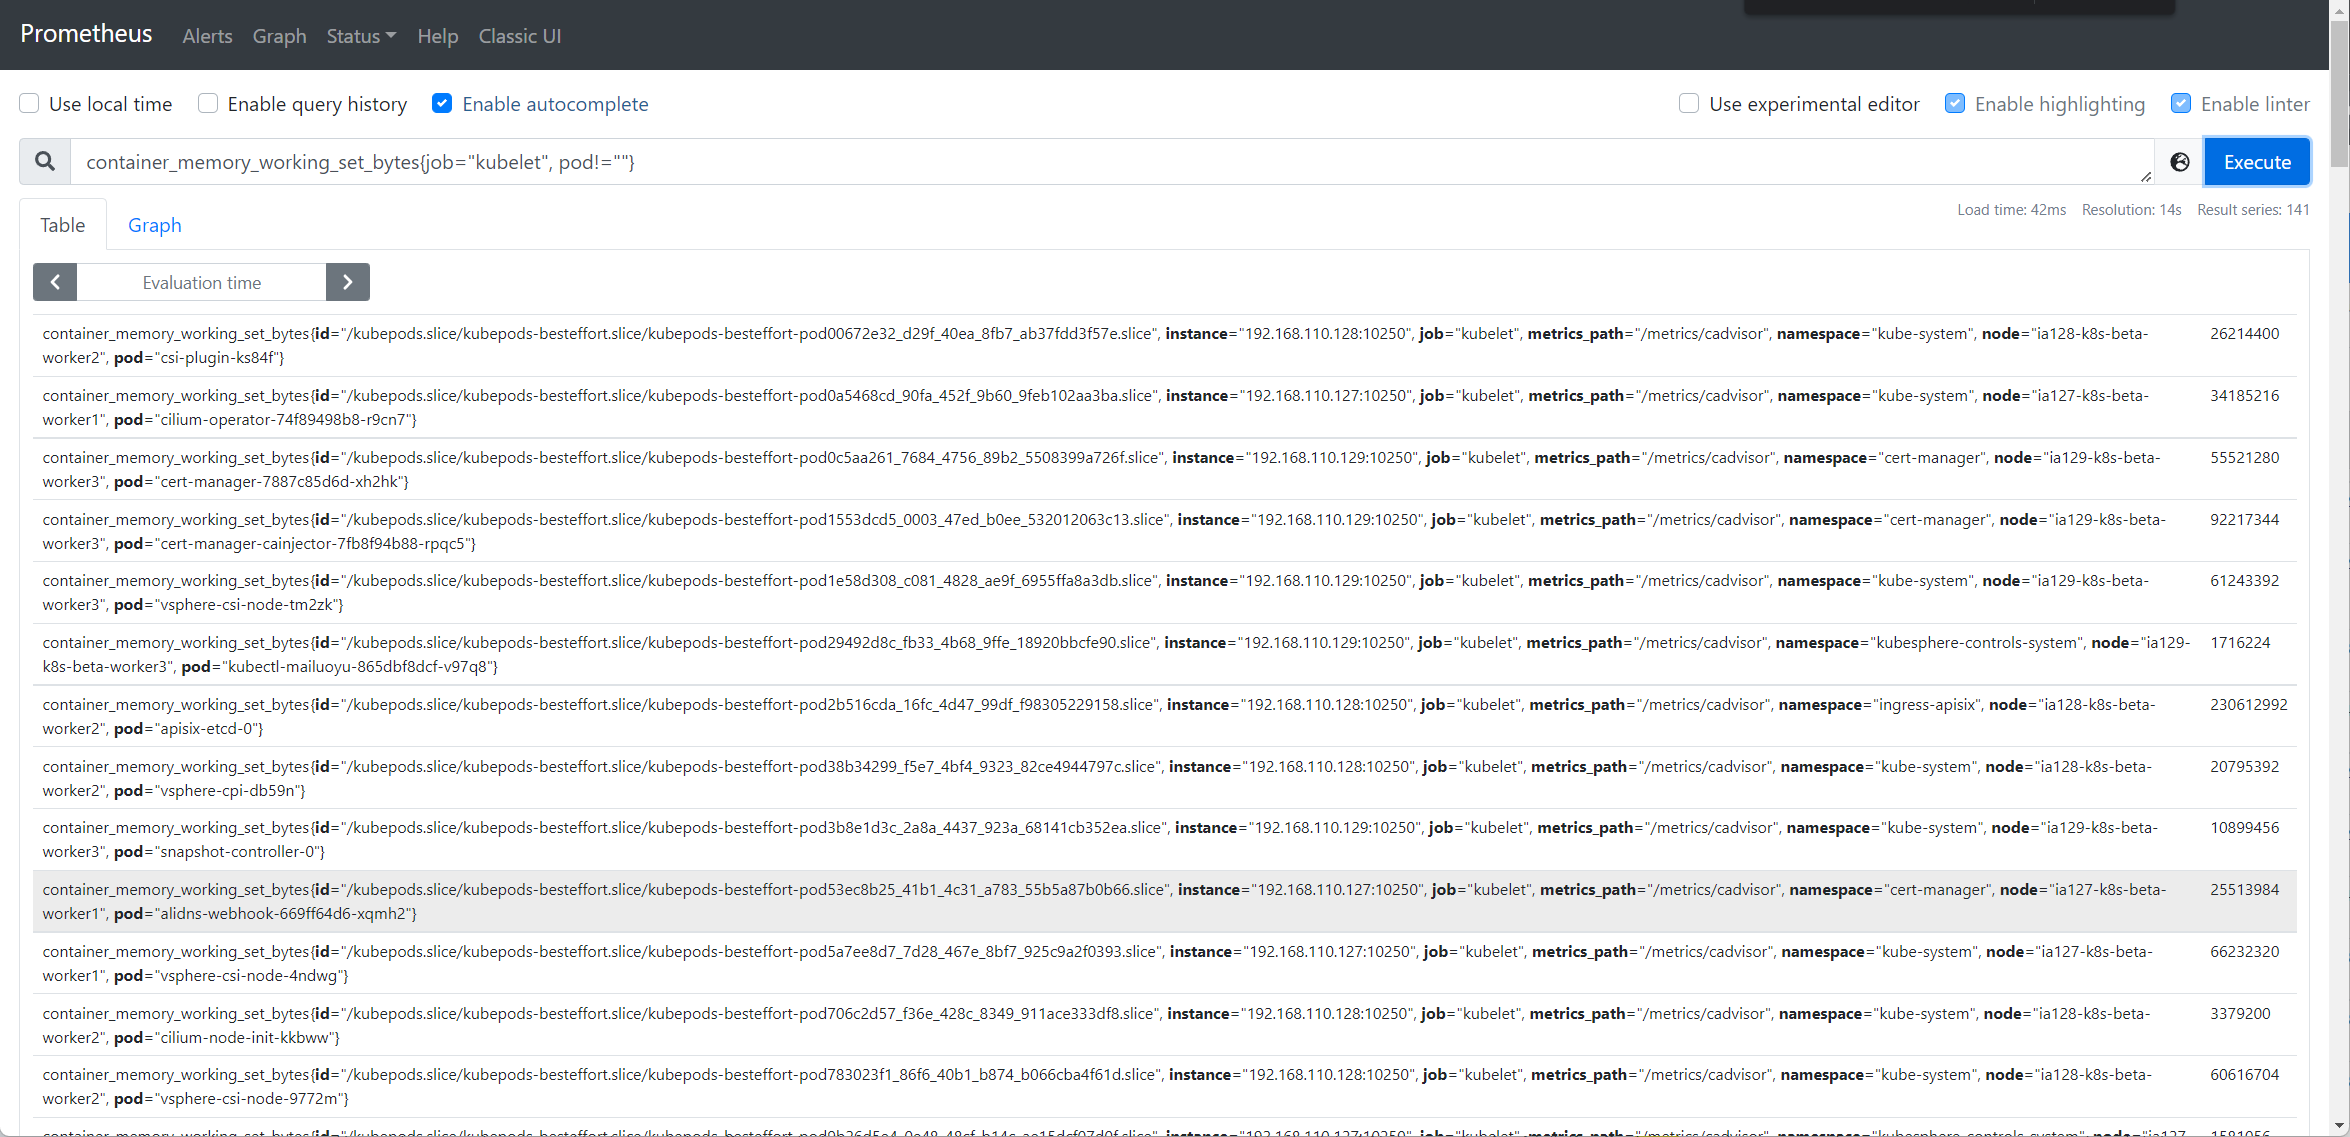
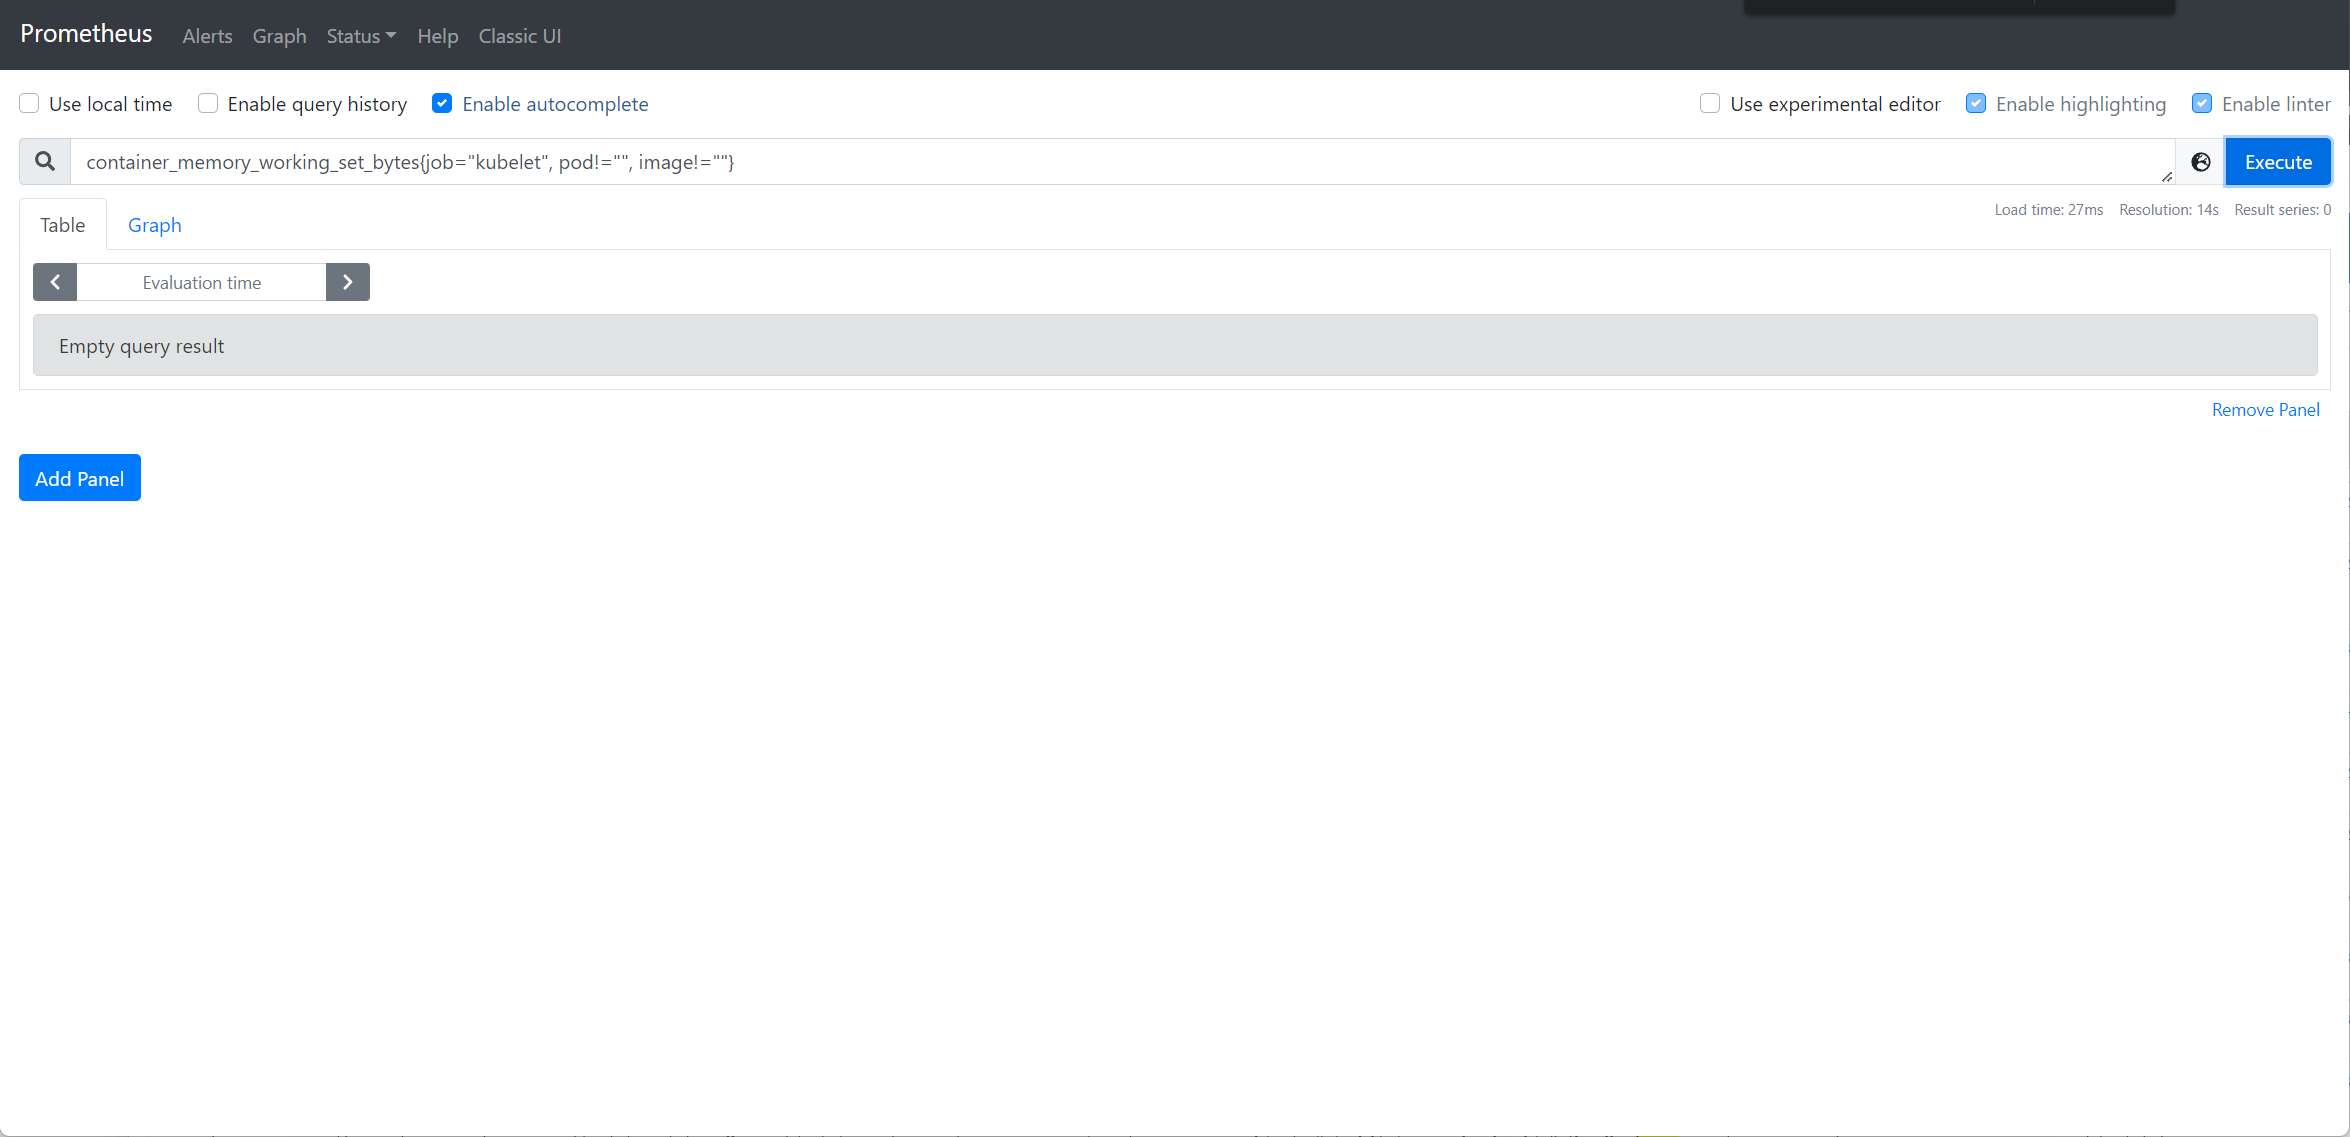
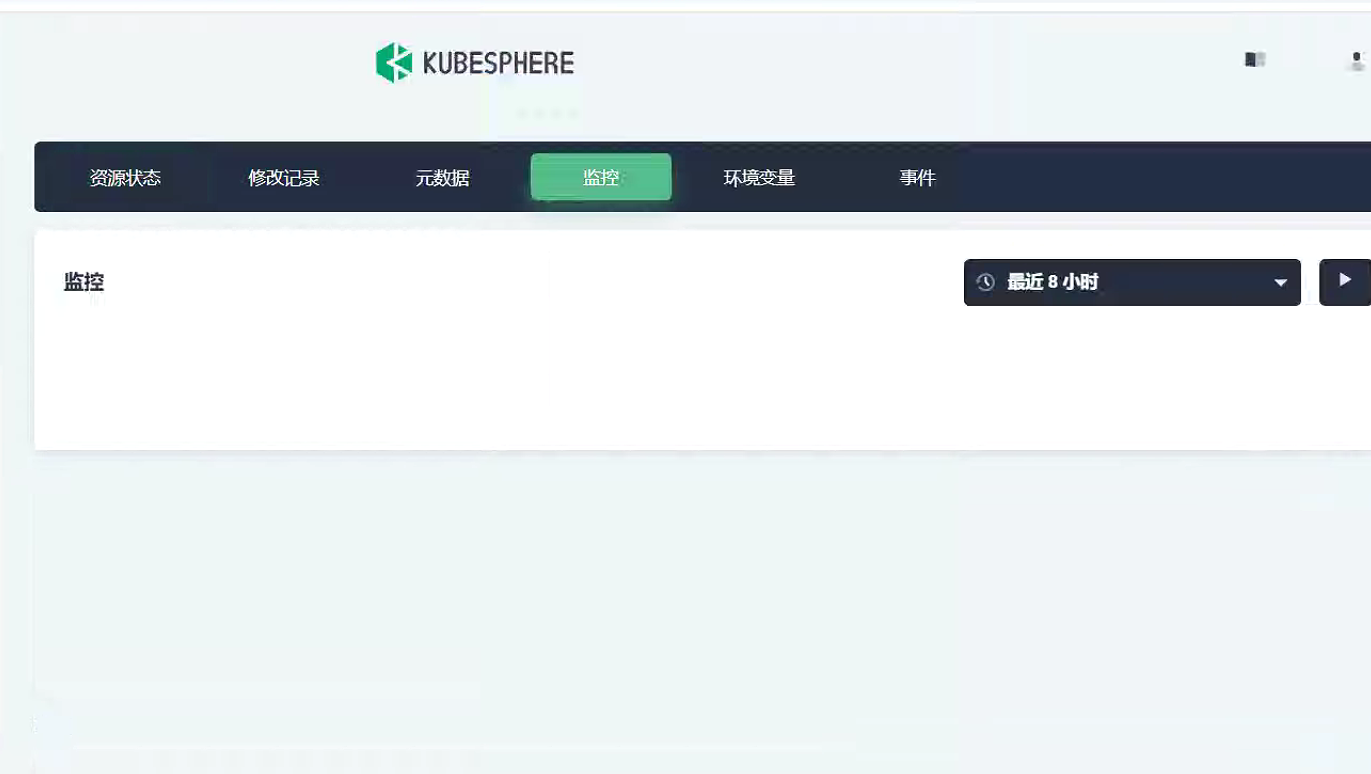
pod 的资源使用不显示

cluster-configuration.yaml
---
apiVersion: installer.kubesphere.io/v1alpha1
kind: ClusterConfiguration
metadata:
name: ks-installer
namespace: kubesphere-system
labels:
version: v3.3.0
spec:
persistence:
storageClass: "vsan-sc" # If there is no default StorageClass in your cluster, you need to specify an existing StorageClass here.
authentication:
jwtSecret: "NxwnhECSnlvcug3GcK" # Keep the jwtSecret consistent with the Host Cluster. Retrieve the jwtSecret by executing "kubectl -n kubesphere-system get cm kubesphere-config -o yaml | grep -v "apiVersion" | grep jwtSecret" on the Host Cluster.
local_registry: "harbor.platform.baidu.cn/ks" # Add your private registry address if it is needed.
# dev_tag: "" # Add your kubesphere image tag you want to install, by default it's same as ks-installer release version.
etcd:
monitoring: false # Enable or disable etcd monitoring dashboard installation. You have to create a Secret for etcd before you enable it.
endpointIps: ""
port: 2379 # etcd port.
tlsEnable: true
common:
core:
console:
enableMultiLogin: true # Enable or disable simultaneous logins. It allows different users to log in with the same account at the same time.
port: 30880
type: NodePort
# apiserver: # Enlarge the apiserver and controller manager's resource requests and limits for the large cluster
# resources: {}
# controllerManager:
# resources: {}
redis:
enabled: false
enableHA: false
volumeSize: 2Gi # Redis PVC size.
openldap:
enabled: false
volumeSize: 2Gi # openldap PVC size.
minio:
volumeSize: 20Gi # Minio PVC size.
monitoring:
# type: external # Whether to specify the external prometheus stack, and need to modify the endpoint at the next line.
endpoint: http://prometheus-operated.kubesphere-monitoring-system.svc:9090 # Prometheus endpoint to get metrics data.
GPUMonitoring: # Enable or disable the GPU-related metrics. If you enable this switch but have no GPU resources, Kubesphere will set it to zero.
enabled: false
gpu: # Install GPUKinds. The default GPU kind is nvidia.com/gpu. Other GPU kinds can be added here according to your needs.
kinds:
- resourceName: "nvidia.com/gpu"
resourceType: "GPU"
default: true
es: # Storage backend for logging, events and auditing.
# master:
# volumeSize: 4Gi # The volume size of Elasticsearch master nodes.
# replicas: 1 # The total number of master nodes. Even numbers are not allowed.
# resources: {}
# data:
# volumeSize: 20Gi # The volume size of Elasticsearch data nodes.
# replicas: 1 # The total number of data nodes.
# resources: {}
logMaxAge: 7 # Log retention time in built-in Elasticsearch. It is 7 days by default.
elkPrefix: logstash # The string making up index names. The index name will be formatted as ks-<elk_prefix>-log.
basicAuth:
enabled: false
username: ""
password: ""
externalElasticsearchHost: ""
externalElasticsearchPort: ""
alerting: # (CPU: 0.1 Core, Memory: 100 MiB) It enables users to customize alerting policies to send messages to receivers in time with different time intervals and alerting levels to choose from.
enabled: false # Enable or disable the KubeSphere Alerting System.
# thanosruler:
# replicas: 1
# resources: {}
auditing: # Provide a security-relevant chronological set of records,recording the sequence of activities happening on the platform, initiated by different tenants.
enabled: false # Enable or disable the KubeSphere Auditing Log System.
# operator:
# resources: {}
# webhook:
# resources: {}
devops: # (CPU: 0.47 Core, Memory: 8.6 G) Provide an out-of-the-box CI/CD system based on Jenkins, and automated workflow tools including Source-to-Image & Binary-to-Image.
enabled: false # Enable or disable the KubeSphere DevOps System.
# resources: {}
jenkinsMemoryLim: 2Gi # Jenkins memory limit.
jenkinsMemoryReq: 1500Mi # Jenkins memory request.
jenkinsVolumeSize: 8Gi # Jenkins volume size.
jenkinsJavaOpts_Xms: 1200m # The following three fields are JVM parameters.
jenkinsJavaOpts_Xmx: 1600m
jenkinsJavaOpts_MaxRAM: 2g
events: # Provide a graphical web console for Kubernetes Events exporting, filtering and alerting in multi-tenant Kubernetes clusters.
enabled: false # Enable or disable the KubeSphere Events System.
# operator:
# resources: {}
# exporter:
# resources: {}
# ruler:
# enabled: true
# replicas: 2
# resources: {}
logging: # (CPU: 57 m, Memory: 2.76 G) Flexible logging functions are provided for log query, collection and management in a unified console. Additional log collectors can be added, such as Elasticsearch, Kafka and Fluentd.
enabled: false # Enable or disable the KubeSphere Logging System.
logsidecar:
enabled: true
replicas: 2
# resources: {}
metrics_server: # (CPU: 56 m, Memory: 44.35 MiB) It enables HPA (Horizontal Pod Autoscaler).
enabled: false # Enable or disable metrics-server.
monitoring:
storageClass: "vsan-sc" # If there is an independent StorageClass you need for Prometheus, you can specify it here. The default StorageClass is used by default.
node_exporter:
port: 9100
# resources: {}
# kube_rbac_proxy:
# resources: {}
# kube_state_metrics:
# resources: {}
# prometheus:
# replicas: 1 # Prometheus replicas are responsible for monitoring different segments of data source and providing high availability.
# volumeSize: 20Gi # Prometheus PVC size.
# resources: {}
# operator:
# resources: {}
# alertmanager:
# replicas: 1 # AlertManager Replicas.
# resources: {}
# notification_manager:
# resources: {}
# operator:
# resources: {}
# proxy:
# resources: {}
gpu: # GPU monitoring-related plug-in installation.
nvidia_dcgm_exporter: # Ensure that gpu resources on your hosts can be used normally, otherwise this plug-in will not work properly.
enabled: false # Check whether the labels on the GPU hosts contain "nvidia.com/gpu.present=true" to ensure that the DCGM pod is scheduled to these nodes.
# resources: {}
multicluster:
clusterRole: member
network:
networkpolicy: # Network policies allow network isolation within the same cluster, which means firewalls can be set up between certain instances (Pods).
# Make sure that the CNI network plugin used by the cluster supports NetworkPolicy. There are a number of CNI network plugins that support NetworkPolicy, including Calico, Cilium, Kube-router, Romana and Weave Net.
enabled: false # Enable or disable network policies.
ippool: # Use Pod IP Pools to manage the Pod network address space. Pods to be created can be assigned IP addresses from a Pod IP Pool.
type: none # Specify "calico" for this field if Calico is used as your CNI plugin. "none" means that Pod IP Pools are disabled.
topology: # Use Service Topology to view Service-to-Service communication based on Weave Scope.
type: none # Specify "weave-scope" for this field to enable Service Topology. "none" means that Service Topology is disabled.
openpitrix: # An App Store that is accessible to all platform tenants. You can use it to manage apps across their entire lifecycle.
store:
enabled: false
servicemesh: # (0.3 Core, 300 MiB) Provide fine-grained traffic management, observability and tracing, and visualized traffic topology.
enabled: false # Base component (pilot). Enable or disable KubeSphere Service Mesh (Istio-based).
istio: # Customizing the istio installation configuration, refer to https://istio.io/latest/docs/setup/additional-setup/customize-installation/
components:
ingressGateways:
- name: istio-ingressgateway
enabled: false
cni:
enabled: false
edgeruntime: # Add edge nodes to your cluster and deploy workloads on edge nodes.
enabled: false
kubeedge: # kubeedge configurations
enabled: false
cloudCore:
cloudHub:
advertiseAddress: # At least a public IP address or an IP address which can be accessed by edge nodes must be provided.
- "" # Note that once KubeEdge is enabled, CloudCore will malfunction if the address is not provided.
service:
cloudhubNodePort: "30000"
cloudhubQuicNodePort: "30001"
cloudhubHttpsNodePort: "30002"
cloudstreamNodePort: "30003"
tunnelNodePort: "30004"
# resources: {}
# hostNetWork: false
iptables-manager:
enabled: true
mode: "external"
# resources: {}
# edgeService:
# resources: {}
gatekeeper: # Provide admission policy and rule management, A validating (mutating TBA) webhook that enforces CRD-based policies executed by Open Policy Agent.
enabled: false # Enable or disable Gatekeeper.
# controller_manager:
# resources: {}
# audit:
# resources: {}
terminal:
# image: 'alpine:3.15' # There must be an nsenter program in the image
timeout: 600 # Container timeout, if set to 0, no timeout will be used. The unit is seconds
kubesphere-installer.yaml
requests:
cpu: 20m
memory: 100Mi
volumeMounts:
- mountPath: /etc/localtime
name: host-time
readOnly: true
volumes:
- hostPath:
path: /etc/localtime
type: ""