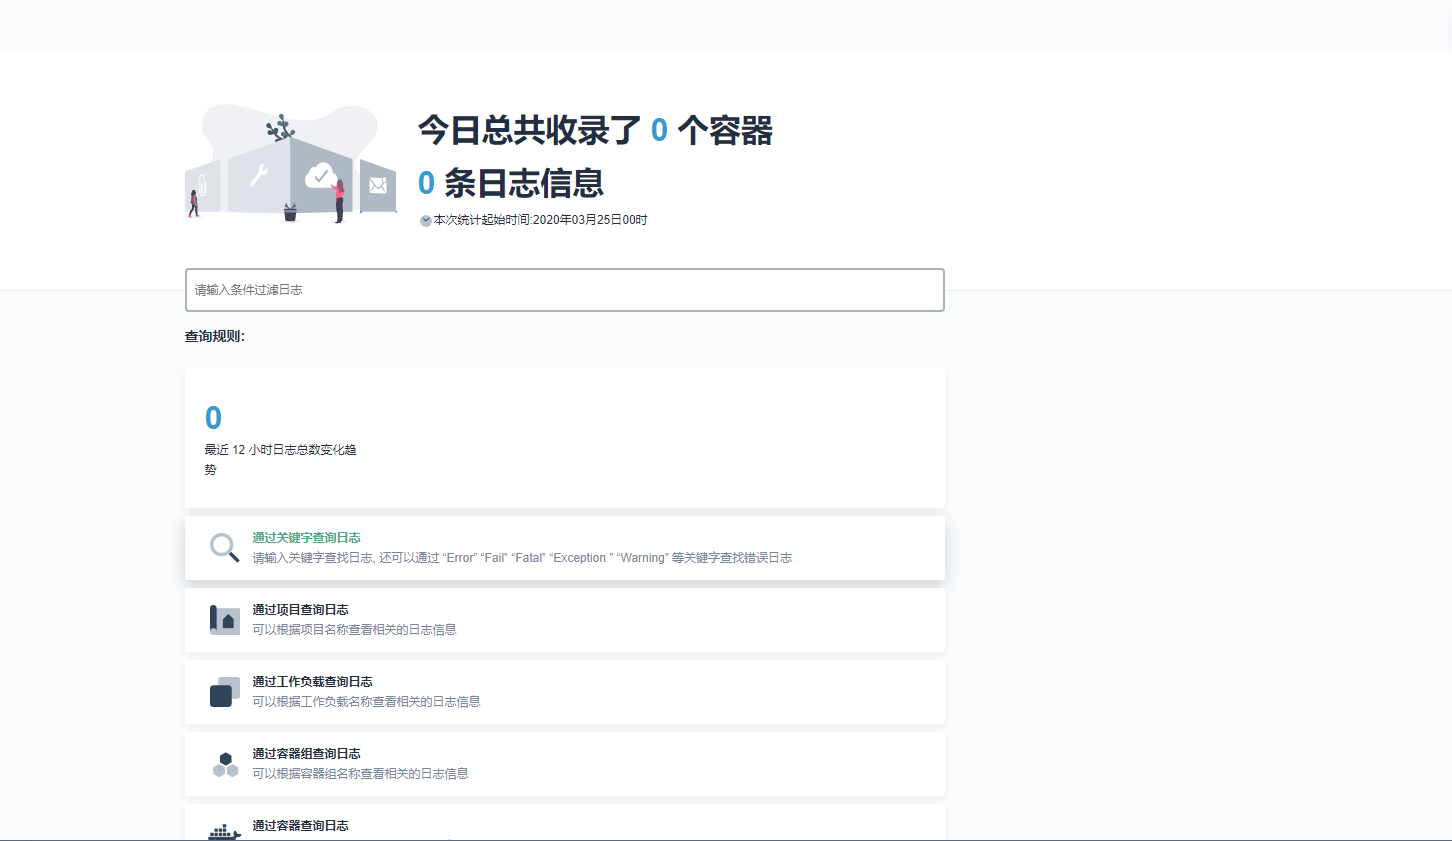
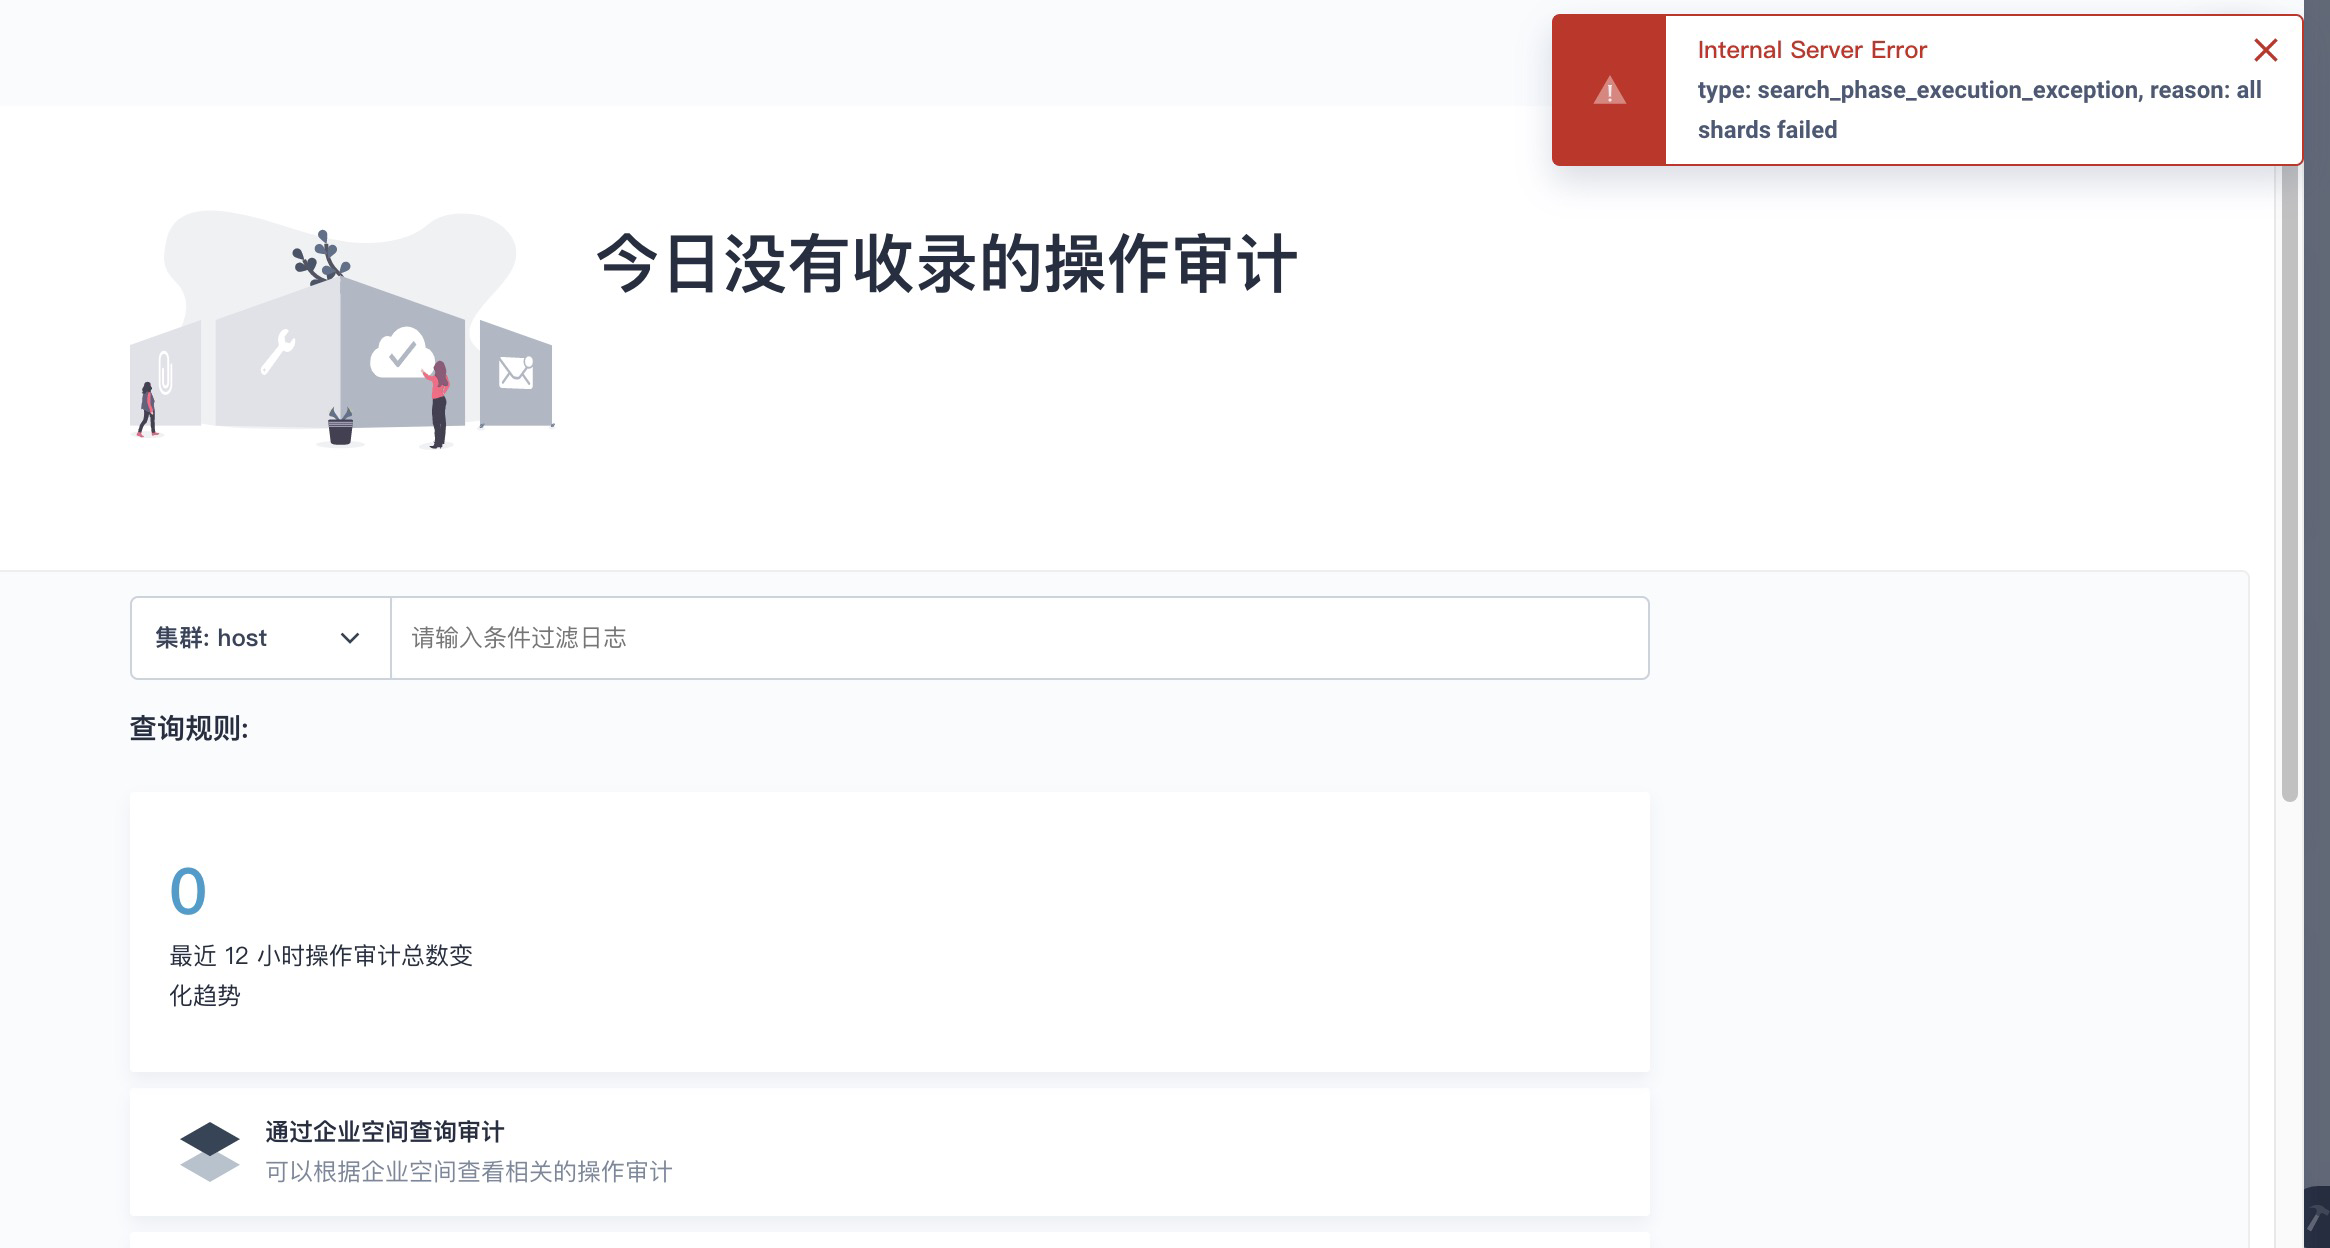
huanggze ks版本: v2.1.1 最近刚升级;
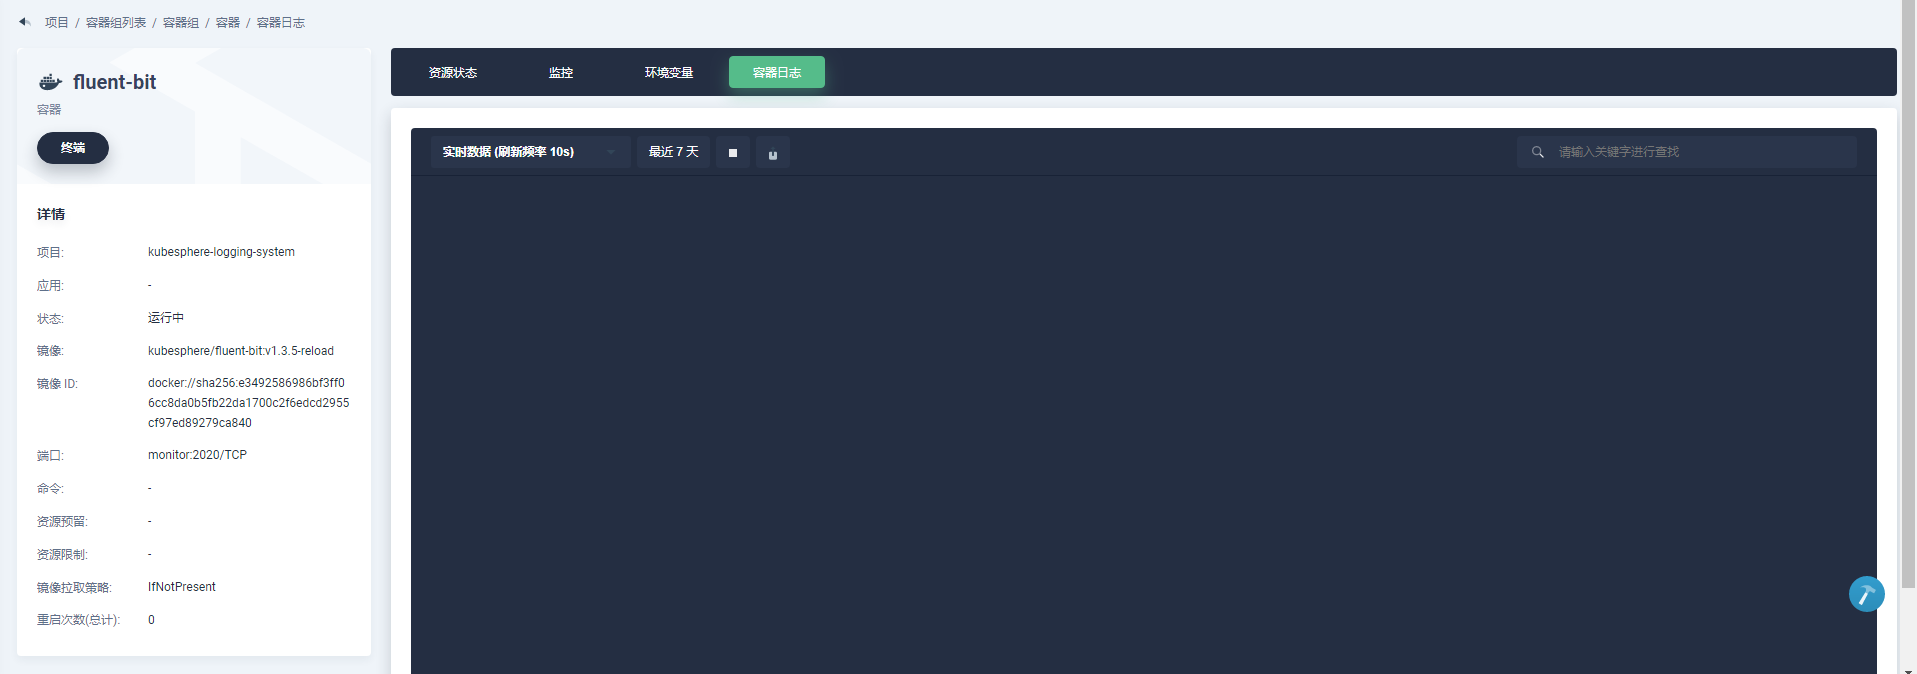
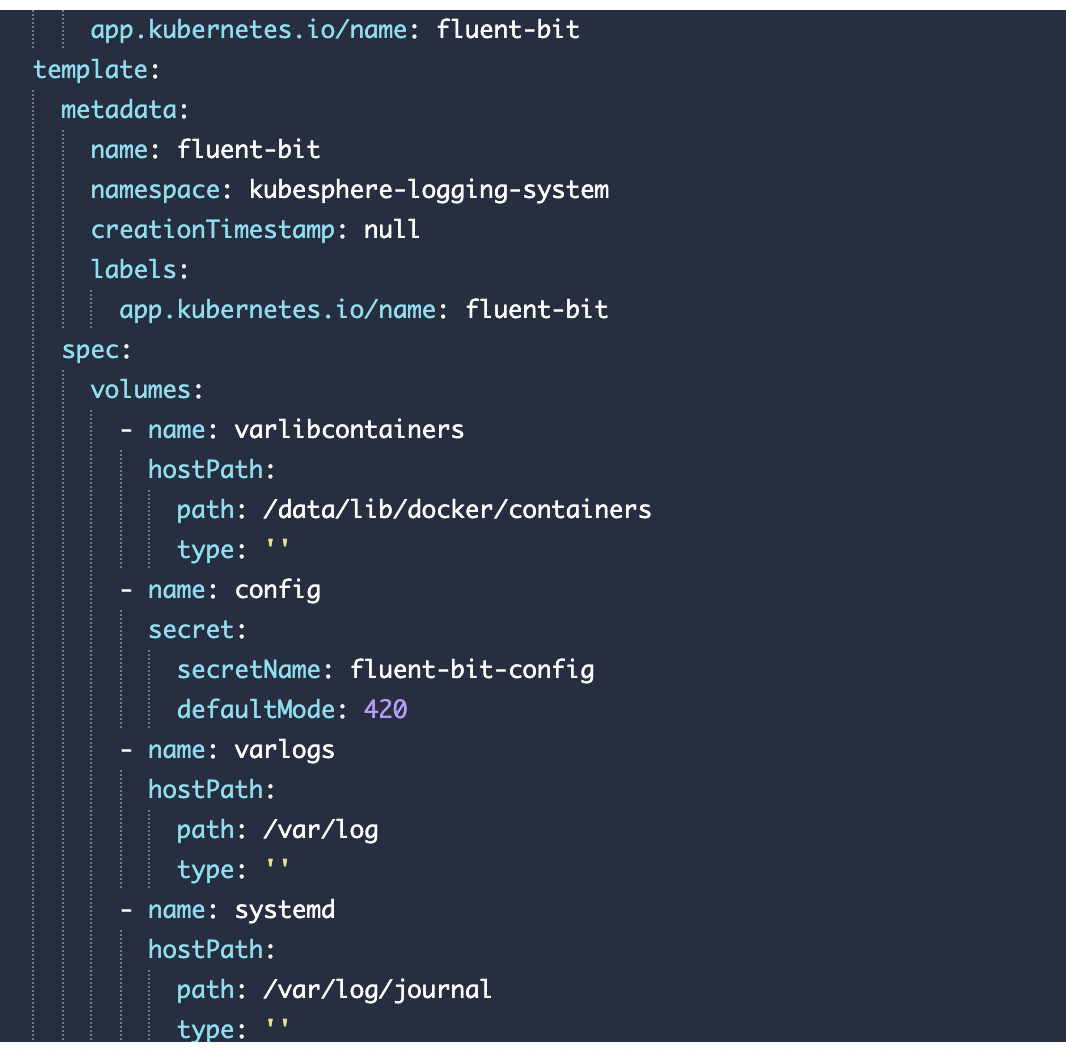
fluent bit日志:
{“took”:60002,“errors”:true,“items”:[{“index”:{“index”:“ks-logstash-log-2020.03.25″,“type”:“flb_type”,“id”:“pSJ_EXEBlWVGs29LF7XF”,“status”:503,“error”:{“type”:“unavailable_shards_exception”,“reason”:“[ks-logstash-log-2020.03.25][2] primary shard is not active Timeout: [1m], request: [BulkShardRequest [[ks-logstash-log-2020.03.25][2]] containing [75] requests]”}}},{“index”:{“index”:“ks-logstash-log-2020.03.25″,“type”:“flb_type”,“id”:“piJ_EXEBlWVGs29LF7XF”,“status”:503,“error”:{“type”:“unavailable_shards_exception”,“reason”:“[ks-logstash-log-2020.03.25][3] primary shard is not active Timeout: [1m], request: [BulkShardRequest [[ks-logstash-log-2020.03.25][3]] containing [79] requests]”}}},{“index”:{“index”:“ks-logstash-log-2020.03.25″,“type”:“flb_type”,“id”:“pyJ_EXEBlWVGs29LF7XF”,“status”:503,“error”:{“type”:“unavailable_shards_exception”,“reason”:"[ks-logstash-log-2020.03.25][2] primary shard is not active Timeout:
[2020/03/25 11:42:14] [error] [out_es] could not pack/validate JSON response
{“took”:60002,“errors”:true,“items”:[{“index”:{“index”:“ks-logstash-log-2020.03.25”,“type”:“flb_type”,“id”:“G5x_EXEBDnFzkOnoF63F”,“status”:503,“error”:{“type”:“unavailable_shards_exception”,“reason”:“[ks-logstash-log-2020.03.25][2] primary shard is not active Timeout: [1m], request: [BulkShardRequest [[ks-logstash-log-2020.03.25][2]] containing [68] requests]”}}},{“index”:{“index”:“ks-logstash-log-2020.03.25”,“type”:“flb_type”,“id”:“HJx_EXEBDnFzkOnoF63F”,“status”:503,“error”:{“type”:“unavailable_shards_exception”,“reason”:“[ks-logstash-log-2020.03.25][2] primary shard is not active Timeout: [1m], request: [BulkShardRequest [[ks-logstash-log-2020.03.25][2]] containing [68] requests]”}}},{“index”:{“index”:“ks-logstash-log-2020.03.25”,“type”:“flb_type”,“id”:“HZx_EXEBDnFzkOnoF63F”,“version”:1,“result”:“created”,“shards”:{“total”:1,“successful”:1,“failed”:0},“seq_no”:891534,“primary_term”:8,“status”:201}},{“index”:
[2020/03/25 11:42:14] [error] [out_es] could not pack/validate JSON response
{“took”:60002,“errors”:true,“items”:[{“index”:{“index”:“ks-logstash-log-2020.03.25″,“type”:“flb_type”,“id”:“tL9_EXEBTvhHfxzBFzDD”,“version”:1,“result”:“created”,“shards”:{“total”:1,“successful”:1,“failed”:0},“seq_no”:887771,“primary_term”:8,“status”:201}},{“index”:{“index”:“ks-logstash-log-2020.03.25″,“type”:“flb_type”,“id”:“tb9_EXEBTvhHfxzBFzDD”,“version”:1,“result”:“created”,“shards”:{“total”:1,“successful”:1,“failed”:0},“seq_no”:891036,“primary_term”:8,“status”:201}},{“index”:{“index”:“ks-logstash-log-2020.03.25”,“type”:“flb_type”,“id”:“tr9_EXEBTvhHfxzBFzDD”,“version”:1,“result”:“created”,“shards”:{“total”:1,“successful”:1,“failed”:0},“seq_no”:891039,“primary_term”:8,“status”:201}},{“index”:{“index”:“ks-logstash-log-2020.03.25″,“type”:“flb_type”,“id”:“t79_EXEBTvhHfxzBFzDD”,“status”:503,“error”:{“type”:“unavailable_shards_exception”,“reason”:"[ks-logstash-log-2020.03.25][2] primary shard is not ac
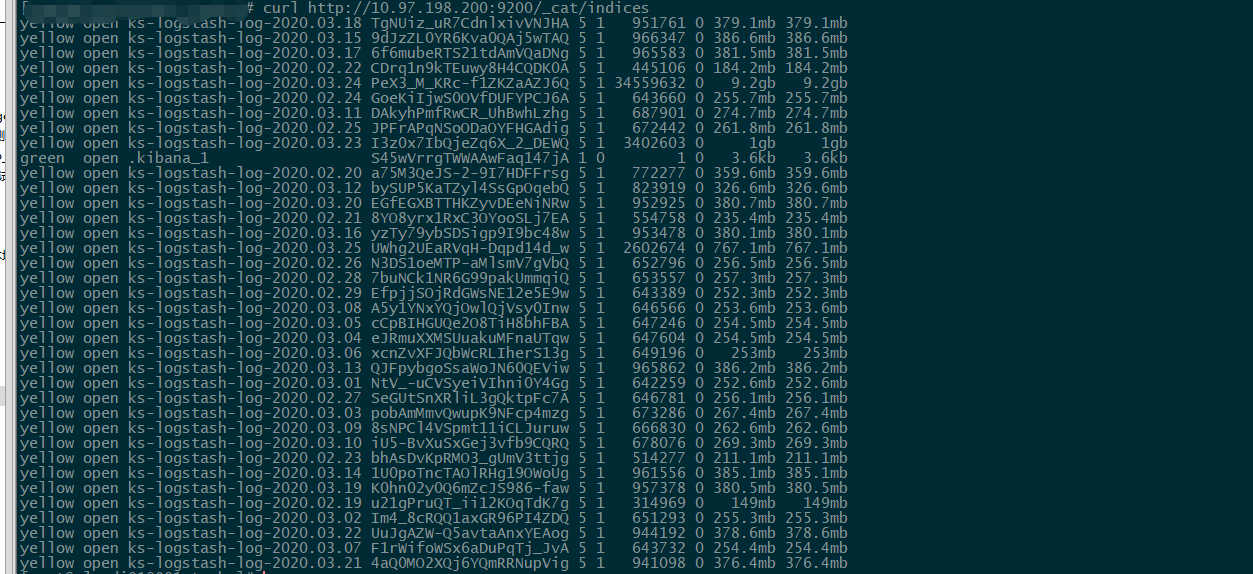
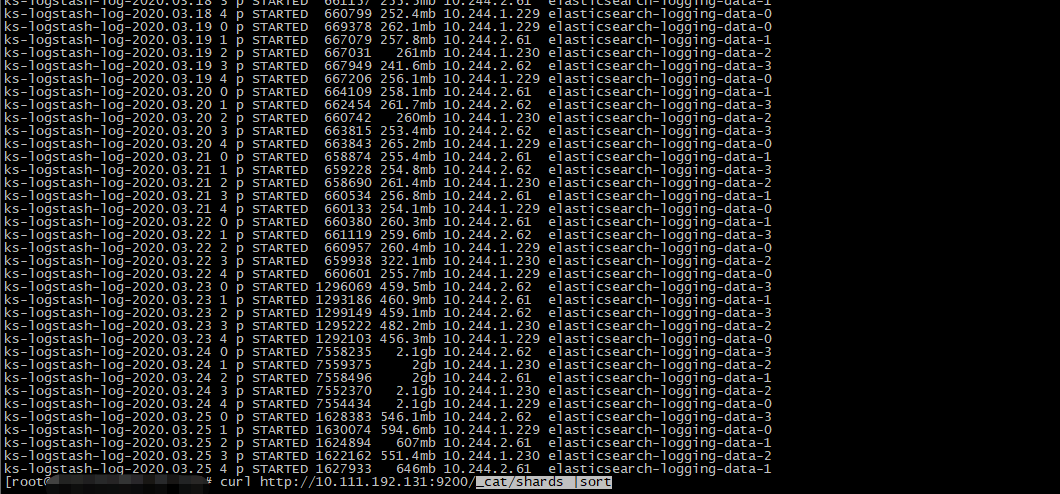
3、es集群状态: