WwnxnK零S
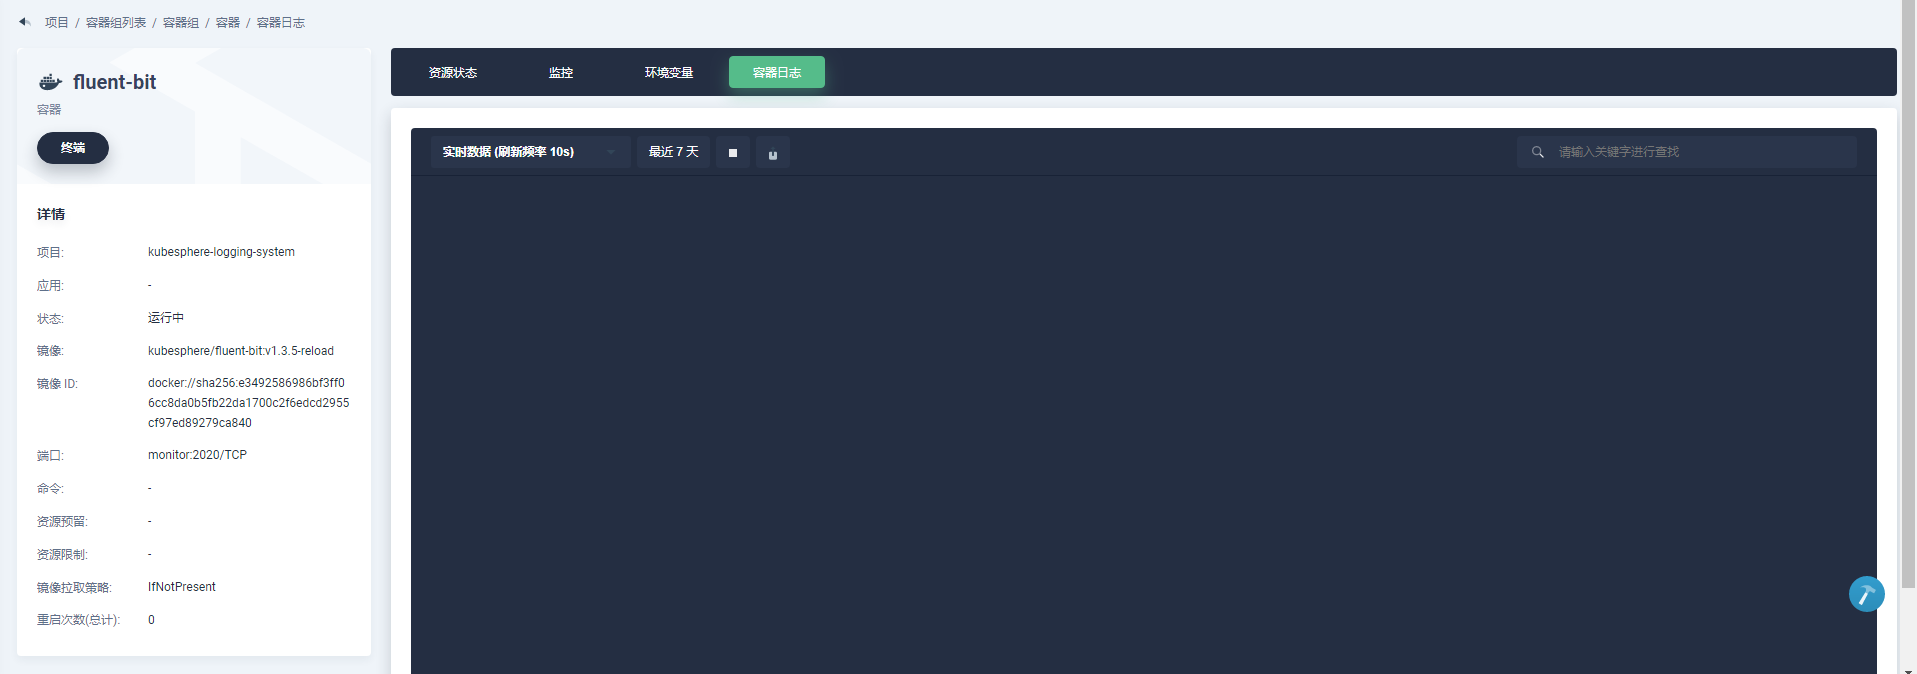
看看后端pod当前状态是否都是正常的
看看后端pod当前状态是否都是正常的
able7 [2020-03-25T08:52:55,150][WARN ][o.e.m.j.JvmGcMonitorService] [elasticsearch-logging-data-0] [gc][1322] overhead, spent [951ms] collecting in the last [1.6s]
[2020-03-25T08:52:56,335][WARN ][o.e.m.j.JvmGcMonitorService] [elasticsearch-logging-data-0] [gc][1323] overhead, spent [894ms] collecting in the last [1.1s]
[2020-03-25T08:52:57,953][WARN ][o.e.m.j.JvmGcMonitorService] [elasticsearch-logging-data-0] [gc][1324] overhead, spent [900ms] collecting in the last [1.6s]
[2020-03-25T08:52:58,954][WARN ][o.e.m.j.JvmGcMonitorService] [elasticsearch-logging-data-0] [gc][1325] overhead, spent [725ms] collecting in the last [1s]
[2020-03-25T08:53:00,290][WARN ][o.e.m.j.JvmGcMonitorService] [elasticsearch-logging-data-0] [gc][1326] overhead, spent [950ms] collecting in the last [1.3s]
[2020-03-25T08:53:01,687][WARN ][o.e.m.j.JvmGcMonitorService] [elasticsearch-logging-data-0] [gc][1327] overhead, spent [878ms] collecting in the last [1.3s]
[2020-03-25T08:53:03,242][WARN ][o.e.m.j.JvmGcMonitorService] [elasticsearch-logging-data-0] [gc][1328] overhead, spent [906ms] collecting in the last [1.5s]
[2020-03-25T08:53:04,377][WARN ][o.e.m.j.JvmGcMonitorService] [elasticsearch-logging-data-0] [gc][1329] overhead, spent [822ms] collecting in the last [1.1s]
[2020-03-25T08:53:05,810][WARN ][o.e.m.j.JvmGcMonitorService] [elasticsearch-logging-data-0] [gc][1330] overhead, spent [857ms] collecting in the last [1.4s]
[2020-03-25T08:53:07,255][WARN ][o.e.m.j.JvmGcMonitorService] [elasticsearch-logging-data-0] [gc][1331] overhead, spent [855ms] collecting in the last [1.4s]
[2020-03-25T08:53:08,379][WARN ][o.e.m.j.JvmGcMonitorService] [elasticsearch-logging-data-0] [gc][1332] overhead, spent [813ms] collecting in the last [1.1s]
[2020-03-25T08:53:09,833][WARN ][o.e.m.j.JvmGcMonitorService] [elasticsearch-logging-data-0] [gc][1333] overhead, spent [800ms] collecting in the last [1.4s]
[2020-03-25T08:53:11,234][WARN ][o.e.m.j.JvmGcMonitorService] [elasticsearch-logging-data-0] [gc][1334] overhead, spent [951ms] collecting in the last [1.4s]
[2020-03-25T08:53:12,411][WARN ][o.e.m.j.JvmGcMonitorService] [elasticsearch-logging-data-0] [gc][1335] overhead, spent [815ms] collecting in the last [1.1s]
[2020-03-25T08:53:13,794][WARN ][o.e.m.j.JvmGcMonitorService] [elasticsearch-logging-data-0] [gc][1336] overhead, spent [1s] collecting in the last [1.3s]
[2020-03-25T08:53:15,116][WARN ][o.e.m.j.JvmGcMonitorService] [elasticsearch-logging-data-0] [gc][1337] overhead, spent [831ms] collecting in the last [1.3s]
[2020-03-25T08:53:16,455][WARN ][o.e.m.j.JvmGcMonitorService] [elasticsearch-logging-data-0] [gc][1338] overhead, spent [937ms] collecting in the last [1.3s]
[2020-03-25T08:53:17,719][WARN ][o.e.m.j.JvmGcMonitorService] [elasticsearch-logging-data-0] [gc][1339] overhead, spent [802ms] collecting in the last [1.2s]
[2020-03-25T08:53:19,285][WARN ][o.e.m.j.JvmGcMonitorService] [elasticsearch-logging-data-0] [gc][1340] overhead, spent [842ms] collecting in the last [1.5s]
[2020-03-25T08:53:20,800][WARN ][o.e.m.j.JvmGcMonitorService] [elasticsearch-logging-data-0] [gc][1341] overhead, spent [841ms] collecting in the last [1.5s]
这是data节点日志。
master节点日志如下:
[2020-03-25T08:41:45,793][WARN ][o.e.c.InternalClusterInfoService] [elasticsearch-logging-discovery-0] Failed to update shard information for ClusterInfoUpdateJob within 15s timeout
[2020-03-25T08:42:31,240][WARN ][o.e.c.InternalClusterInfoService] [elasticsearch-logging-discovery-0] Failed to update shard information for ClusterInfoUpdateJob within 15s timeout
[2020-03-25T08:43:16,369][WARN ][o.e.c.InternalClusterInfoService] [elasticsearch-logging-discovery-0] Failed to update shard information for ClusterInfoUpdateJob within 15s timeout
[2020-03-25T08:44:01,589][WARN ][o.e.c.InternalClusterInfoService] [elasticsearch-logging-discovery-0] Failed to update shard information for ClusterInfoUpdateJob within 15s timeout
[2020-03-25T08:46:36,392][WARN ][o.e.c.InternalClusterInfoService] [elasticsearch-logging-discovery-0] Failed to update shard information for ClusterInfoUpdateJob within 15s timeout
[2020-03-25T08:47:21,995][WARN ][o.e.c.InternalClusterInfoService] [elasticsearch-logging-discovery-0] Failed to update shard information for ClusterInfoUpdateJob within 15s timeout
[2020-03-25T08:49:25,080][WARN ][o.e.c.InternalClusterInfoService] [elasticsearch-logging-discovery-0] Failed to update shard information for ClusterInfoUpdateJob within 15s timeout
[2020-03-25T08:50:10,626][WARN ][o.e.c.InternalClusterInfoService] [elasticsearch-logging-discovery-0] Failed to update shard information for ClusterInfoUpdateJob within 15s timeout
[2020-03-25T08:51:34,821][WARN ][o.e.c.InternalClusterInfoService] [elasticsearch-logging-discovery-0] Failed to update shard information for ClusterInfoUpdateJob within 15s timeout
[2020-03-25T08:52:20,460][WARN ][o.e.c.InternalClusterInfoService] [elasticsearch-logging-discovery-0] Failed to update shard information for ClusterInfoUpdateJob within 15s timeout
[2020-03-25T08:53:47,331][WARN ][o.e.c.InternalClusterInfoService] [elasticsearch-logging-discovery-0] Failed to update shard information for ClusterInfoUpdateJob within 15s timeout
huanggze ks版本: v2.1.1 最近刚升级;
fluent bit日志:
{“took”:60002,“errors”:true,“items”:[{“index”:{“index”:“ks-logstash-log-2020.03.25″,“type”:“flb_type”,“id”:“pSJ_EXEBlWVGs29LF7XF”,“status”:503,“error”:{“type”:“unavailable_shards_exception”,“reason”:“[ks-logstash-log-2020.03.25][2] primary shard is not active Timeout: [1m], request: [BulkShardRequest [[ks-logstash-log-2020.03.25][2]] containing [75] requests]”}}},{“index”:{“index”:“ks-logstash-log-2020.03.25″,“type”:“flb_type”,“id”:“piJ_EXEBlWVGs29LF7XF”,“status”:503,“error”:{“type”:“unavailable_shards_exception”,“reason”:“[ks-logstash-log-2020.03.25][3] primary shard is not active Timeout: [1m], request: [BulkShardRequest [[ks-logstash-log-2020.03.25][3]] containing [79] requests]”}}},{“index”:{“index”:“ks-logstash-log-2020.03.25″,“type”:“flb_type”,“id”:“pyJ_EXEBlWVGs29LF7XF”,“status”:503,“error”:{“type”:“unavailable_shards_exception”,“reason”:"[ks-logstash-log-2020.03.25][2] primary shard is not active Timeout:
[2020/03/25 11:42:14] [error] [out_es] could not pack/validate JSON response
{“took”:60002,“errors”:true,“items”:[{“index”:{“index”:“ks-logstash-log-2020.03.25”,“type”:“flb_type”,“id”:“G5x_EXEBDnFzkOnoF63F”,“status”:503,“error”:{“type”:“unavailable_shards_exception”,“reason”:“[ks-logstash-log-2020.03.25][2] primary shard is not active Timeout: [1m], request: [BulkShardRequest [[ks-logstash-log-2020.03.25][2]] containing [68] requests]”}}},{“index”:{“index”:“ks-logstash-log-2020.03.25”,“type”:“flb_type”,“id”:“HJx_EXEBDnFzkOnoF63F”,“status”:503,“error”:{“type”:“unavailable_shards_exception”,“reason”:“[ks-logstash-log-2020.03.25][2] primary shard is not active Timeout: [1m], request: [BulkShardRequest [[ks-logstash-log-2020.03.25][2]] containing [68] requests]”}}},{“index”:{“index”:“ks-logstash-log-2020.03.25”,“type”:“flb_type”,“id”:“HZx_EXEBDnFzkOnoF63F”,“version”:1,“result”:“created”,“shards”:{“total”:1,“successful”:1,“failed”:0},“seq_no”:891534,“primary_term”:8,“status”:201}},{“index”:
[2020/03/25 11:42:14] [error] [out_es] could not pack/validate JSON response
{“took”:60002,“errors”:true,“items”:[{“index”:{“index”:“ks-logstash-log-2020.03.25″,“type”:“flb_type”,“id”:“tL9_EXEBTvhHfxzBFzDD”,“version”:1,“result”:“created”,“shards”:{“total”:1,“successful”:1,“failed”:0},“seq_no”:887771,“primary_term”:8,“status”:201}},{“index”:{“index”:“ks-logstash-log-2020.03.25″,“type”:“flb_type”,“id”:“tb9_EXEBTvhHfxzBFzDD”,“version”:1,“result”:“created”,“shards”:{“total”:1,“successful”:1,“failed”:0},“seq_no”:891036,“primary_term”:8,“status”:201}},{“index”:{“index”:“ks-logstash-log-2020.03.25”,“type”:“flb_type”,“id”:“tr9_EXEBTvhHfxzBFzDD”,“version”:1,“result”:“created”,“shards”:{“total”:1,“successful”:1,“failed”:0},“seq_no”:891039,“primary_term”:8,“status”:201}},{“index”:{“index”:“ks-logstash-log-2020.03.25″,“type”:“flb_type”,“id”:“t79_EXEBTvhHfxzBFzDD”,“status”:503,“error”:{“type”:“unavailable_shards_exception”,“reason”:"[ks-logstash-log-2020.03.25][2] primary shard is not ac
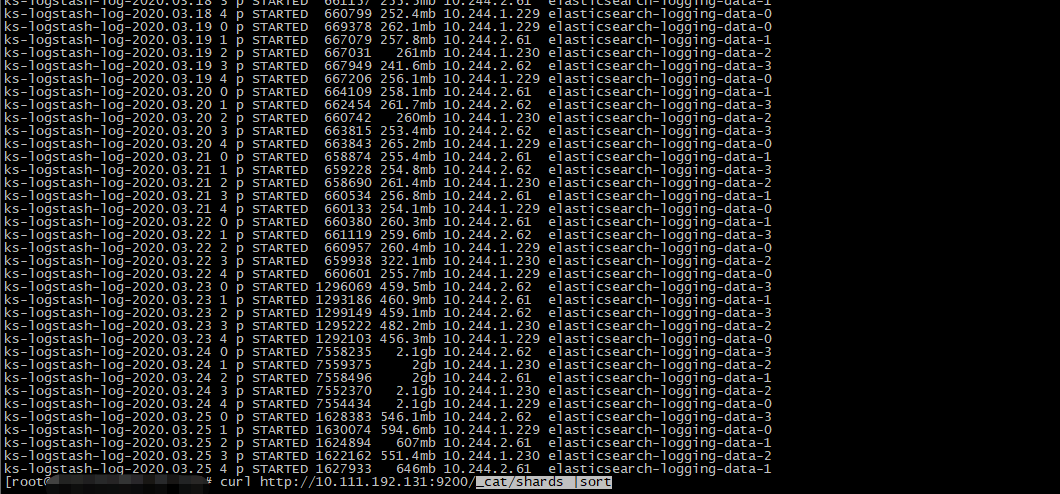
3、es集群状态:

再次感谢kubesphere@yunify.com 大佬支持。在此整理下排错思路。
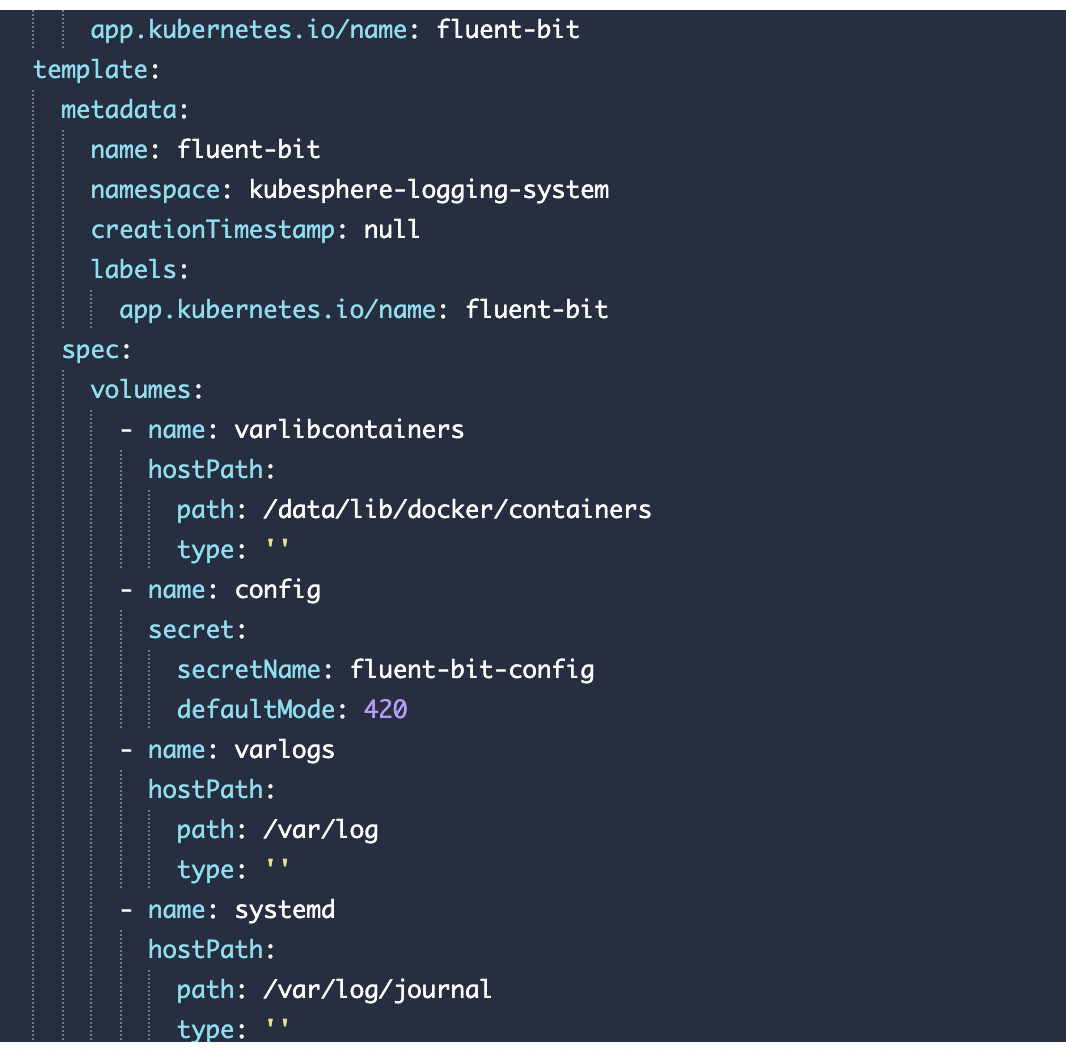
1、首先根据以下issue查看相关配置是否有误,比如说日志的路径需要根据实际情况修改;我这边就是/data1/docker/containers这个路径:
https://github.com/kubesphere/kubesphere/issues/680
2、查看es集群的状态是否正常,符合预期。
由于我这边k8s内服务非常多,产生的日志量也非常大,1 master/2 data节点部署方式,确实撑不住,一堆GC报错,后面调整成1master/5 data节点,并且修改es集群的相关jvm参数后,集群状态是正常的
curl http://10.106.215.141:9200/_cluster/health?pretty=true
curl http://10.106.215.141:9200/_cat/indices
curl http://10.106.215.141:9200/_cat/shards
curl http://10.106.215.141:9200/ks-logstash-log-2020.03.27/_search 通过以上命令我简单查看集群是否ok
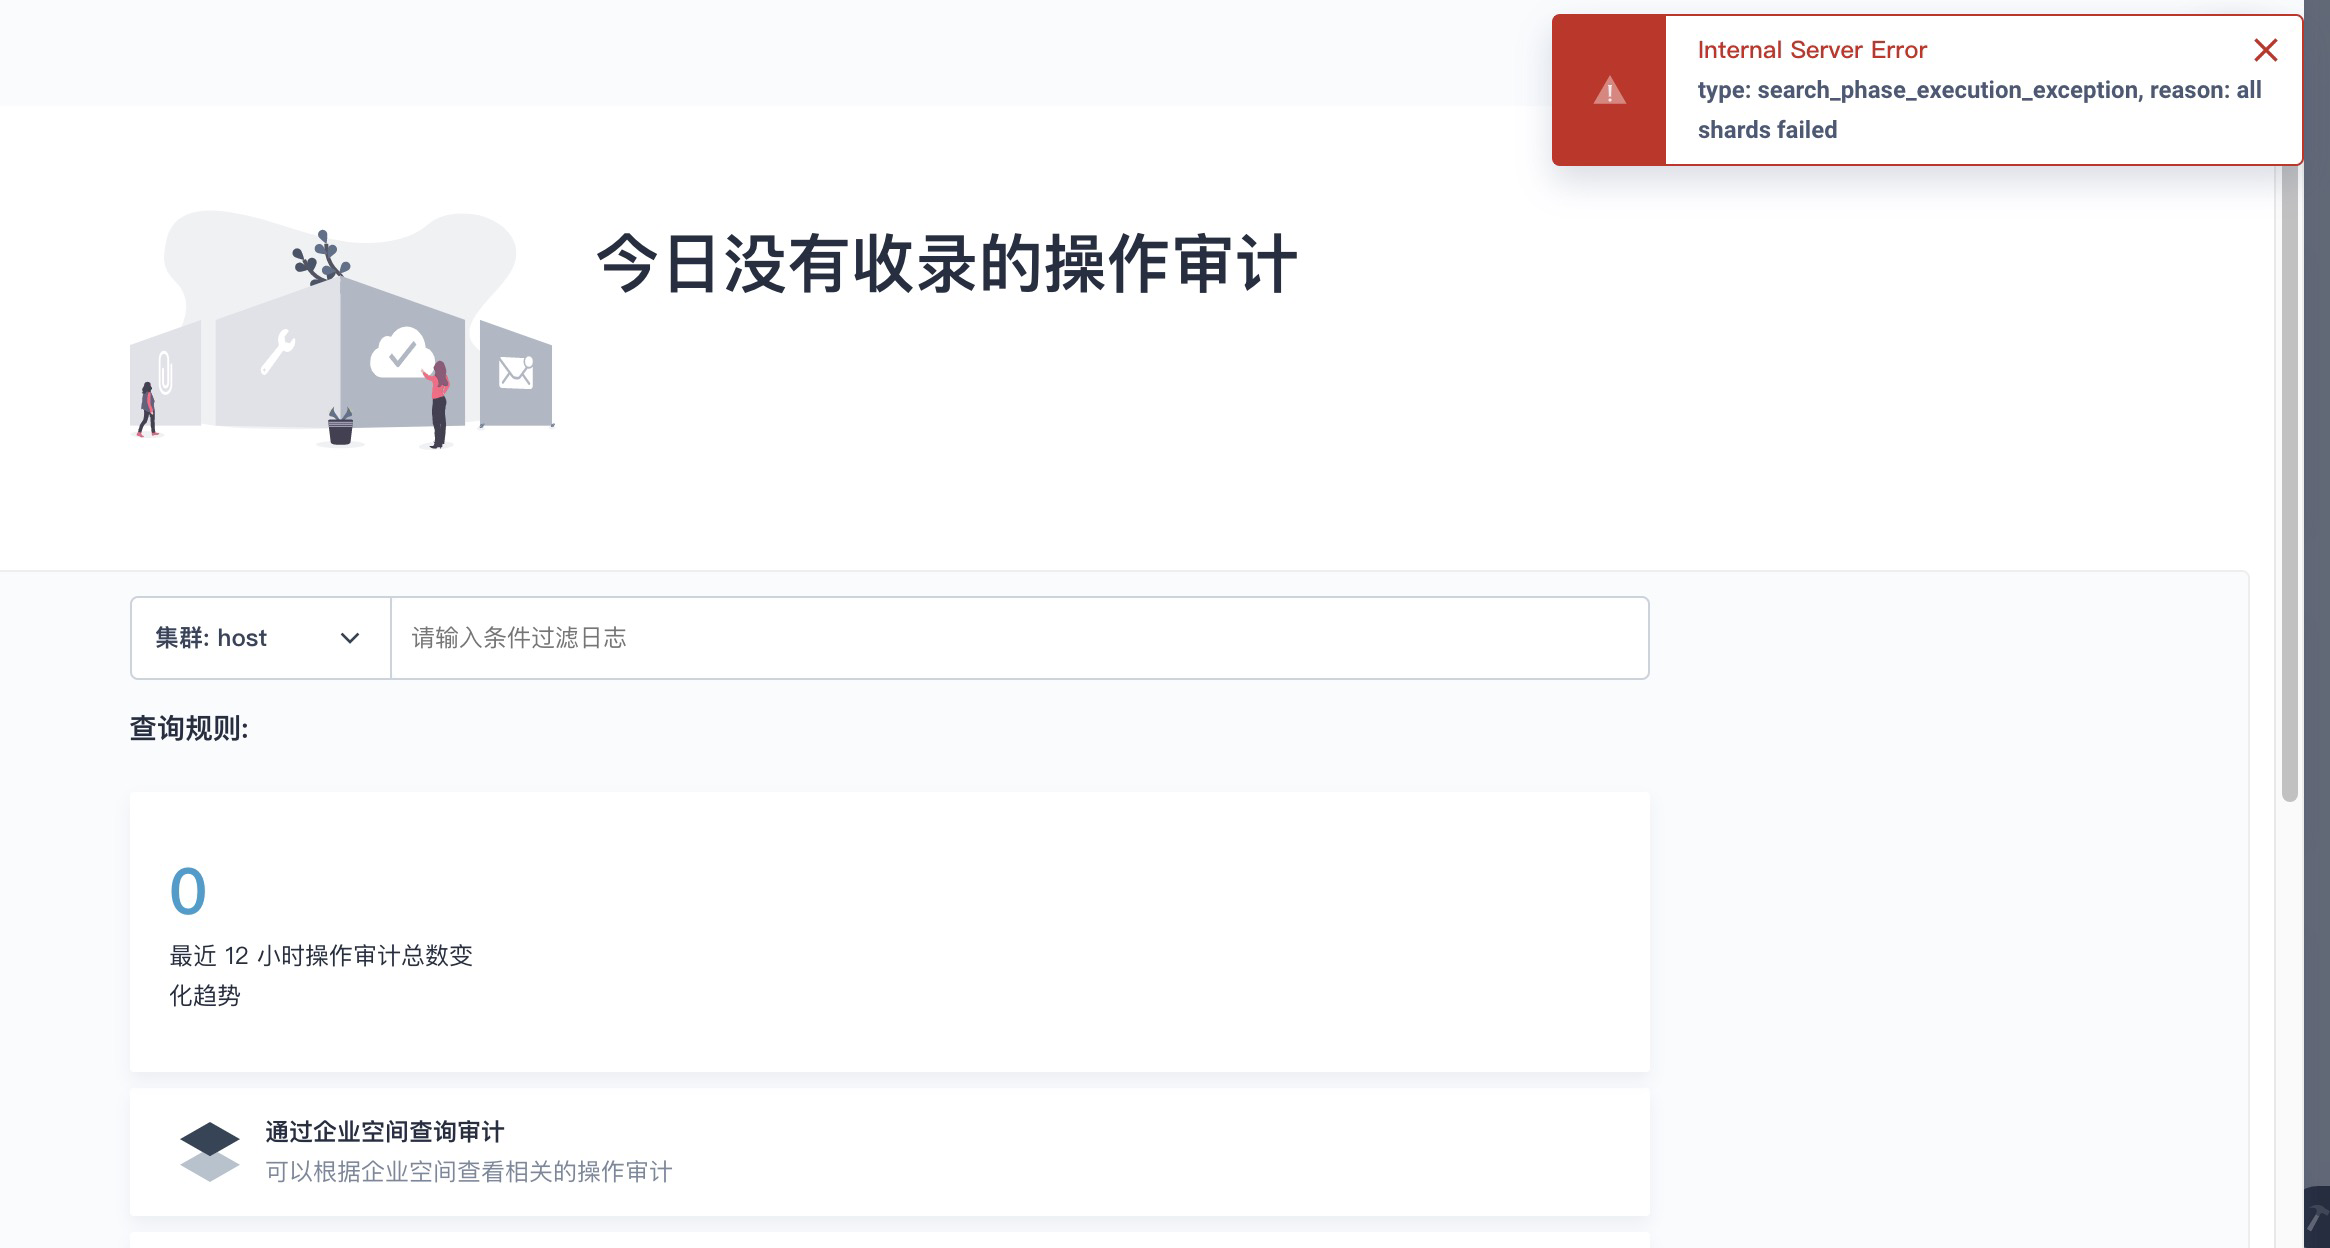
3、我这边确保以上2个问题都得到解决的情况下,前端仍然显示不了日志,然后去查看api的问题:
因为kubesphere ks-apiserver只是封装es的API接口,我们进入ks-apiserver里面查看
apk add curl
curl localhost:9090/kapis/logging.kubesphere.io/v1alpha2/cluster
接口返回是空的。
4、后面让开发去单步调试代码,发现开发合ks-apiserver代码有些问题,我们这边针对kubesphere做了一些定制开发,代码合并出现问题,导致ks-apiserver出了问题,现在已解决。
tips: kubesphere-config cm里面关于logging的配置,也需要仔细检查,不能出现配置错误。
以上就是排查过程。感谢kubesphere@yunify.com支持
 willqyK零S
V3.2.1 也遇到同样问题,es日志显示页面为空

fluentbit-operator日志
[root@Ops-repo ~]# kubectl -n kubesphere-logging-system logs -f fluentbit-operator-745bf5559f-wxrb4
I0308 03:08:37.589870 1 request.go:668] Waited for 1.00297623s due to client-side throttling, not priority and fairness, request: GET:https://10.233.0.1:443/apis/monitoring.coreos.com/v1?timeout=32s
2022-03-08T03:08:38.696Z INFO controller-runtime.metrics metrics server is starting to listen {"addr": ":8080"}
2022-03-08T03:08:38.697Z INFO setup starting manager
2022-03-08T03:08:39.099Z INFO controller-runtime.manager.controller.fluentbitconfig Starting EventSource {"reconciler group": "logging.kubesphere.io", "reconciler kind": "FluentBitConfig", "source": "kind source: /, Kind="}
2022-03-08T03:08:39.099Z INFO controller-runtime.manager.controller.fluentbitconfig Starting EventSource {"reconciler group": "logging.kubesphere.io", "reconciler kind": "FluentBitConfig", "source": "kind source: /, Kind="}
2022-03-08T03:08:39.099Z INFO controller-runtime.manager.controller.fluentbitconfig Starting EventSource {"reconciler group": "logging.kubesphere.io", "reconciler kind": "FluentBitConfig", "source": "kind source: /, Kind="}
2022-03-08T03:08:39.099Z INFO controller-runtime.manager.controller.fluentbitconfig Starting EventSource {"reconciler group": "logging.kubesphere.io", "reconciler kind": "FluentBitConfig", "source": "kind source: /, Kind="}
2022-03-08T03:08:39.099Z INFO controller-runtime.manager.controller.fluentbitconfig Starting EventSource {"reconciler group": "logging.kubesphere.io", "reconciler kind": "FluentBitConfig", "source": "kind source: /, Kind="}
2022-03-08T03:08:39.099Z INFO controller-runtime.manager.controller.fluentbitconfig Starting EventSource {"reconciler group": "logging.kubesphere.io", "reconciler kind": "FluentBitConfig", "source": "kind source: /, Kind="}
2022-03-08T03:08:39.099Z INFO controller-runtime.manager.controller.fluentbitconfig Starting Controller {"reconciler group": "logging.kubesphere.io", "reconciler kind": "FluentBitConfig"}
2022-03-08T03:08:39.099Z INFO controller-runtime.manager starting metrics server {"path": "/metrics"}
2022-03-08T03:08:39.099Z INFO controller-runtime.manager.controller.fluentbit Starting EventSource {"reconciler group": "logging.kubesphere.io", "reconciler kind": "FluentBit", "source": "kind source: /, Kind="}
2022-03-08T03:08:39.100Z INFO controller-runtime.manager.controller.fluentbit Starting EventSource {"reconciler group": "logging.kubesphere.io", "reconciler kind": "FluentBit", "source": "kind source: /, Kind="}
2022-03-08T03:08:39.100Z INFO controller-runtime.manager.controller.fluentbit Starting EventSource {"reconciler group": "logging.kubesphere.io", "reconciler kind": "FluentBit", "source": "kind source: /, Kind="}
2022-03-08T03:08:39.100Z INFO controller-runtime.manager.controller.fluentbit Starting Controller {"reconciler group": "logging.kubesphere.io", "reconciler kind": "FluentBit"}
2022-03-08T03:08:42.497Z ERROR controller-runtime.source if kind is a CRD, it should be installed before calling Start {"kind": "FluentBit.logging.kubesphere.io", "error": "no matches for kind \"FluentBit\" in version \"logging.kubesphere.io/v1alpha2\""}
sigs.k8s.io/controller-runtime/pkg/source.(*Kind).Start.func1
/go/pkg/mod/sigs.k8s.io/controller-runtime@v0.9.6/pkg/source/source.go:127
2022-03-08T03:08:42.497Z ERROR controller-runtime.manager.controller.fluentbit Could not wait for Cache to sync {"reconciler group": "logging.kubesphere.io", "reconciler kind": "FluentBit", "error": "failed to wait for fluentbit caches to sync: no matches for kind \"FluentBit\" in version \"logging.kubesphere.io/v1alpha2\""}
sigs.k8s.io/controller-runtime/pkg/internal/controller.(*Controller).Start.func2
/go/pkg/mod/sigs.k8s.io/controller-runtime@v0.9.6/pkg/internal/controller/controller.go:195
sigs.k8s.io/controller-runtime/pkg/internal/controller.(*Controller).Start
/go/pkg/mod/sigs.k8s.io/controller-runtime@v0.9.6/pkg/internal/controller/controller.go:221
sigs.k8s.io/controller-runtime/pkg/manager.(*controllerManager).startRunnable.func1
/go/pkg/mod/sigs.k8s.io/controller-runtime@v0.9.6/pkg/manager/internal.go:696
2022-03-08T03:08:42.586Z ERROR controller-runtime.manager.controller.fluentbitconfig Could not wait for Cache to sync {"reconciler group": "logging.kubesphere.io", "reconciler kind": "FluentBitConfig", "error": "failed to wait for fluentbitconfig caches to sync: timed out waiting for cache to be synced"}
sigs.k8s.io/controller-runtime/pkg/internal/controller.(*Controller).Start.func2
/go/pkg/mod/sigs.k8s.io/controller-runtime@v0.9.6/pkg/internal/controller/controller.go:195
sigs.k8s.io/controller-runtime/pkg/internal/controller.(*Controller).Start
/go/pkg/mod/sigs.k8s.io/controller-runtime@v0.9.6/pkg/internal/controller/controller.go:221
sigs.k8s.io/controller-runtime/pkg/manager.(*controllerManager).startRunnable.func1
/go/pkg/mod/sigs.k8s.io/controller-runtime@v0.9.6/pkg/manager/internal.go:696
2022-03-08T03:08:42.586Z ERROR controller-runtime.manager error received after stop sequence was engaged {"error": "failed to wait for fluentbitconfig caches to sync: timed out waiting for cache to be synced"}
2022-03-08T03:08:42.586Z ERROR setup problem running manager {"error": "failed to wait for fluentbit caches to sync: no matches for kind \"FluentBit\" in version \"logging.kubesphere.io/v1alpha2\""}
main.main
/workspace/main.go:114
runtime.main
/usr/local/go/src/runtime/proc.go:225
[root@Ops-repo ~]#